
Note
Go to the end to download the full example code.
Coherent interference between Born terms#
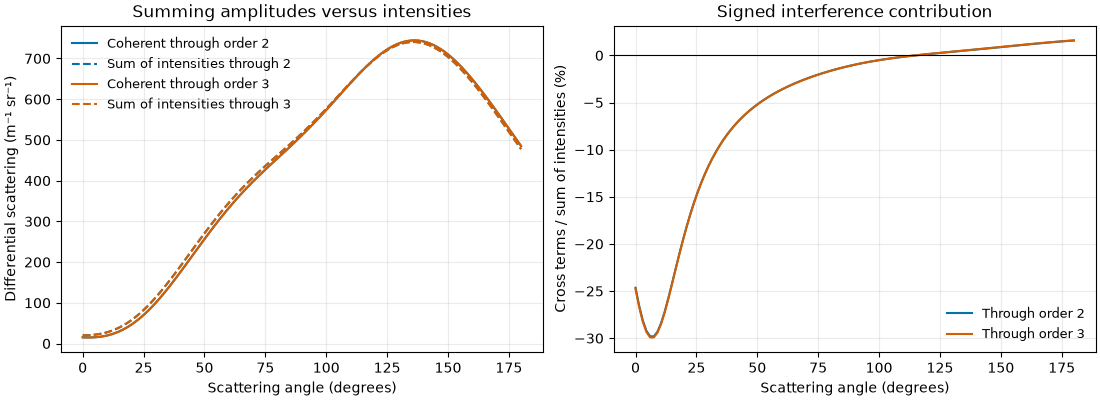
Cumulative Born scattering sums complex amplitudes before taking their squared magnitude. Adding isolated-term intensities omits the cross terms and produces a different result. This example compares those two operations on the same seeded finite volume and exposes the signed interference.
The two incident polarizations are averaged incoherently, while successive
Born terms for each polarization interfere coherently. All orders retain
the linearized dielectric contrast 2 * n0 * delta_n and the equal-volume
spherical Green self cell with its longitudinal contact term. A small
correction or decreasing field norms does not certify Born convergence.
from bornsim.medium.random_medium import GaussianMedium

import sys

import matplotlib.pyplot as plt
import numpy as np

from bornsim import Grid, Solver, Source
from bornsim.units import ureg

medium = GaussianMedium(
    refractive_index_std=0.03,
    correlation_length=80 * ureg.nanometer,
    background_refractive_index=1.33,
)

grid = Grid(
    shape=(6, 6, 6),
    spacing=40 * ureg.nanometer,
)

volume = medium.to_volume(
    grid=grid,
    seed=42,
)

angles = np.linspace(0, 180, 121) * ureg.degree

source_configuration_1 = Source(wavelength=633 * ureg.nanometer)

solver = Solver(
    source=source_configuration_1,
    order=3,
)

result = solver.solve_cut(
    target=volume,
    angles=angles,
)

coherent = result.differential.to("1 / meter / steradian").magnitude

isolated = result.term_differential.to("1 / meter / steradian").magnitude

incoherent = np.cumsum(isolated, axis=0)

figure, (intensity_axis, interference_axis) = plt.subplots(1, 2, figsize=(11, 4), layout="constrained")

for order, color in ((2, "#0072B2"), (3, "#D55E00")):
    index = order - 1

    intensity_axis.plot(
        angles.magnitude,
        coherent[index],
        color=color,
        label=f"Coherent through order {order}",
    )

    intensity_axis.plot(
        angles.magnitude,
        incoherent[index],
        "--",
        color=color,
        label=f"Sum of intensities through {order}",
    )

    relative_cross_terms = np.divide(
        coherent[index] - incoherent[index],
        incoherent[index],
        out=np.full_like(incoherent[index], np.nan),
        where=incoherent[index] > 0,
    )

    interference_axis.plot(
        angles.magnitude,
        100 * relative_cross_terms,
        color=color,
        label=f"Through order {order}",
    )

intensity_axis.set(ylabel="Differential scattering (m⁻¹ sr⁻¹)", title="Summing amplitudes versus intensities")

interference_axis.axhline(0, color="black", linewidth=0.8)

interference_axis.set(ylabel="Cross terms / sum of intensities (%)", title="Signed interference contribution")

for axis in (intensity_axis, interference_axis):
    axis.set(xlabel="Scattering angle (degrees)")

    axis.legend(frameon=False, fontsize=9)

    axis.grid(alpha=0.25)

plt.show()
Inspect the medium in 3D#
Inspect the actual finite input sample with physical spatial axes. Drag to rotate and scroll to zoom in the embedded browser view. Regions with higher refractive index are more opaque; opacity is not absorption.
medium_figure = volume.plot_3d(
    mode="volume",
    field="refractive_index",
    opacity_scale="increasing",
)

if "--no-browser" not in sys.argv:
    medium_figure.show(renderer="browser")
Total running time of the script: (0 minutes 0.292 seconds)