
Note
Go to the end to download the full example code.
Theory figure: translation and directional interference#
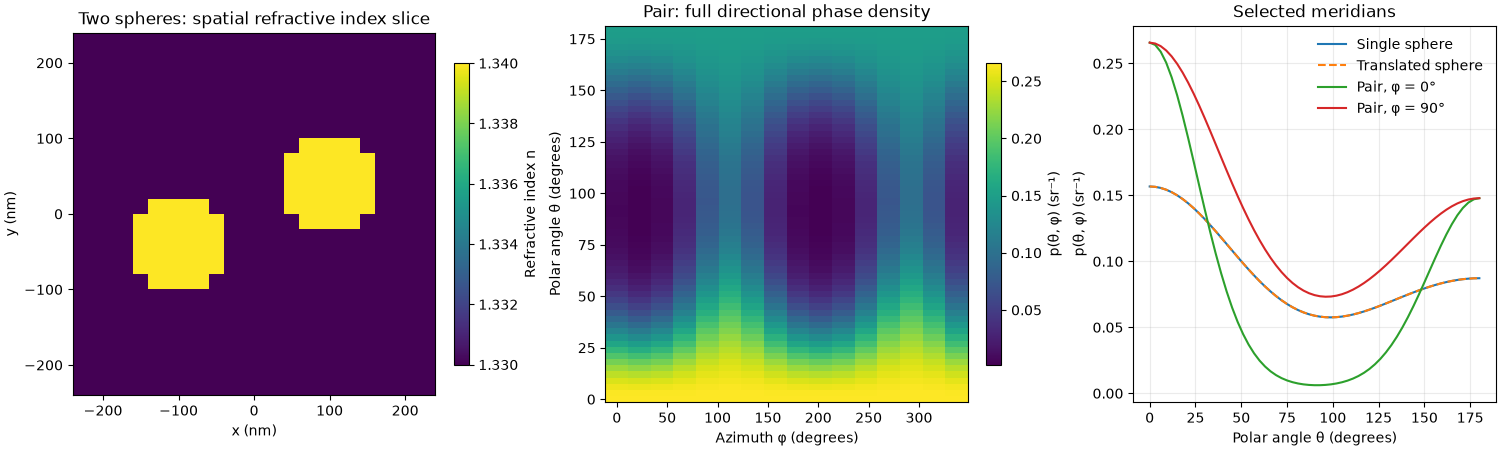
At first Born order, translating a complete scatterer multiplies its far-field amplitude by a unit-modulus phase. Its intensity is unchanged. Adding a second scatterer changes relative phases and generally introduces azimuth-dependent interference. This figure compares these two effects on fixed voxel masks using the numerical solver, without realization averaging.
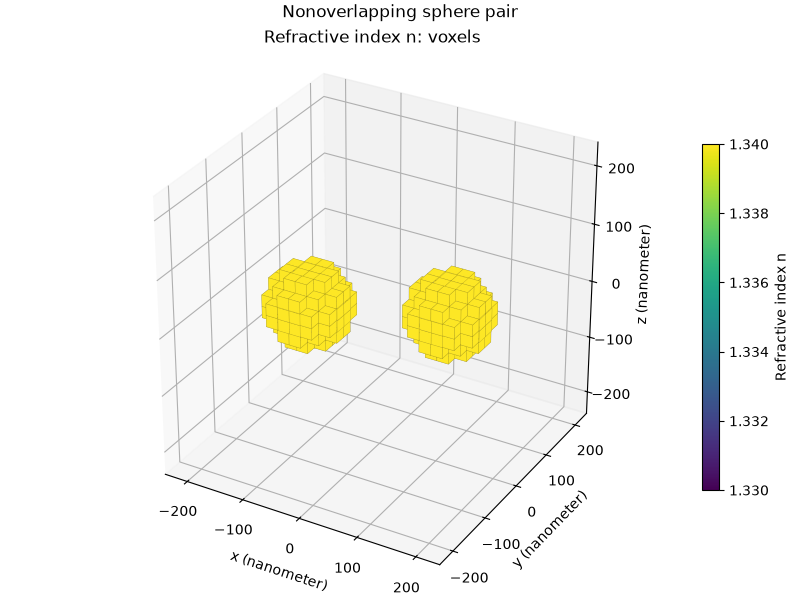
The two spheres are nonoverlapping. Their material refractive index is 1.34 in a 1.33 background; all calculations retain the linearized dielectric contrast. A 20 nm voxel grid is illustrative, not a claim of converged sphere geometry.
import sys

import matplotlib.pyplot as plt
import numpy as np

from bornsim import AngularSampling, Grid, Material, Solver, Source, Sphere, StructuredMedium
from bornsim.units import ureg

grid = Grid(
    shape=(24, 24, 24),
    spacing=20 * ureg.nanometer,
)

sampling = AngularSampling(
    start=0 * ureg.degree,
    end=180 * ureg.degree,
    n_points=61,
    polar_samples=32,
    azimuth_samples=16,
)

material = Material(refractive_index=1.34)

sphere = Sphere(
    radius=60 * ureg.nanometer,
    material=material,
)

translated = sphere.translated(offset=(80, 40, 20) * ureg.nanometer)

left = sphere.translated(offset=(-100, -40, 0) * ureg.nanometer)

right = sphere.translated(offset=(100, 40, 0) * ureg.nanometer)

source_configuration_1 = Source(wavelength=633 * ureg.nanometer)

solver = Solver(
    source=source_configuration_1,
    sampling=sampling,
    order=1,
)

volumes_by_arrangement = {}

results = []

for shapes, medium_label in (
    ((sphere,), "Centred sphere"),
    ((translated,), "Translated sphere"),
    ((left, right), "Nonoverlapping sphere pair"),
):
    medium = StructuredMedium()

    medium.add_background(refractive_index=1.33)

    medium.add_structures(*shapes)

    volume = medium.to_volume(grid=grid)

    volumes_by_arrangement[medium_label] = volume

    result = solver.solve(target=volume)

    results.append(result)

centred_result, translated_result, pair_result = results

relative_difference = (
    np.max(np.abs(centred_result.differential.magnitude - translated_result.differential.magnitude))
    / centred_result.differential.magnitude.max()
)

print(f"Maximum translation intensity difference / peak: {relative_difference:.3e}")

# Both masks are exact integer-voxel translations, fully contained in the box.
np.testing.assert_allclose(
    translated_result.differential.magnitude,
    centred_result.differential.magnitude,
    rtol=1e-10,
    atol=centred_result.differential.magnitude.max() * 1e-12,
)
Maximum translation intensity difference / peak: 2.981e-15
Compare spatial slices and directional scattering#
figure, axes = plt.subplots(1, 3, figsize=(15, 4.5), layout="constrained")

image = axes[0].imshow(
    (volume.background_refractive_index + volume.delta_refractive_index[:, :, grid.shape[2] // 2]).T,
    origin="lower",
    extent=(-240, 240, -240, 240),
    cmap="viridis",
)

axes[0].set(xlabel="x (nm)", ylabel="y (nm)", title="Two spheres: spatial refractive index slice")

figure.colorbar(image, ax=axes[0], label="Refractive index n", shrink=0.8)

heatmap = axes[1].pcolormesh(
    pair_result.azimuths.to("degree").magnitude,
    pair_result.angles.to("degree").magnitude,
    pair_result.phase_function.magnitude[0],
    shading="nearest",
    cmap="viridis",
)

axes[1].set(
    xlabel="Azimuth φ (degrees)", ylabel="Polar angle θ (degrees)", title="Pair: full directional phase density"
)

figure.colorbar(heatmap, ax=axes[1], label="p(θ, φ) (sr⁻¹)", shrink=0.8)

for result, azimuth, label, style in (
    (centred_result, 0, "Single sphere", "-"),
    (translated_result, 0, "Translated sphere", "--"),
    (pair_result, 0, "Pair, φ = 0°", "-"),
    (pair_result, 90, "Pair, φ = 90°", "-"),
):
    meridian = result.meridian(azimuth=azimuth * ureg.degree)

    axes[2].plot(
        meridian.angles.to("degree").magnitude,
        meridian.phase_function.magnitude[0],
        linestyle=style,
        label=label,
    )

axes[2].set(xlabel="Polar angle θ (degrees)", ylabel="p(θ, φ) (sr⁻¹)", title="Selected meridians")

axes[2].legend(frameon=False)

axes[2].grid(alpha=0.25)

plt.show()
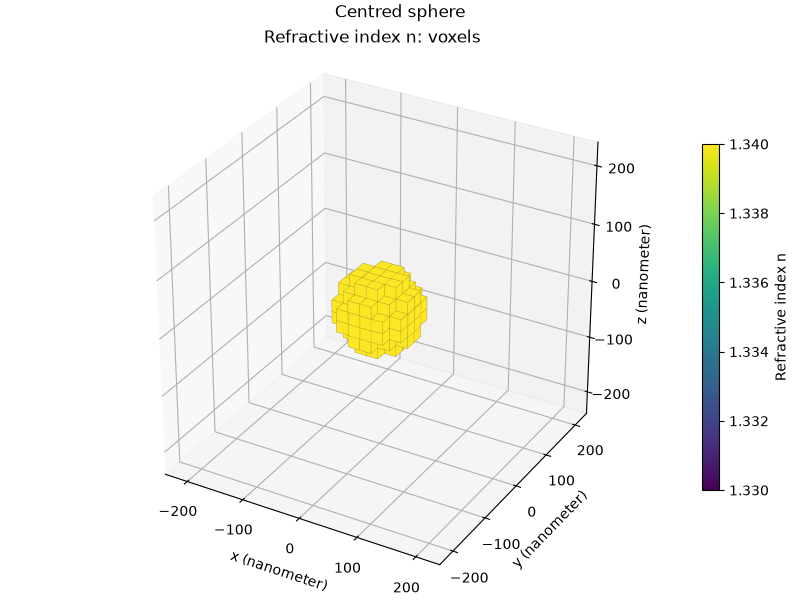
Centred sphere in 3D#
Show one finite input sample with its physical spatial axes.
preview_volume = volumes_by_arrangement["Centred sphere"]

medium_figure = preview_volume.plot_3d(
    backend="matplotlib",
    mode="voxels",
    field="refractive_index",
)

medium_figure.suptitle("Centred sphere")

plt.show()
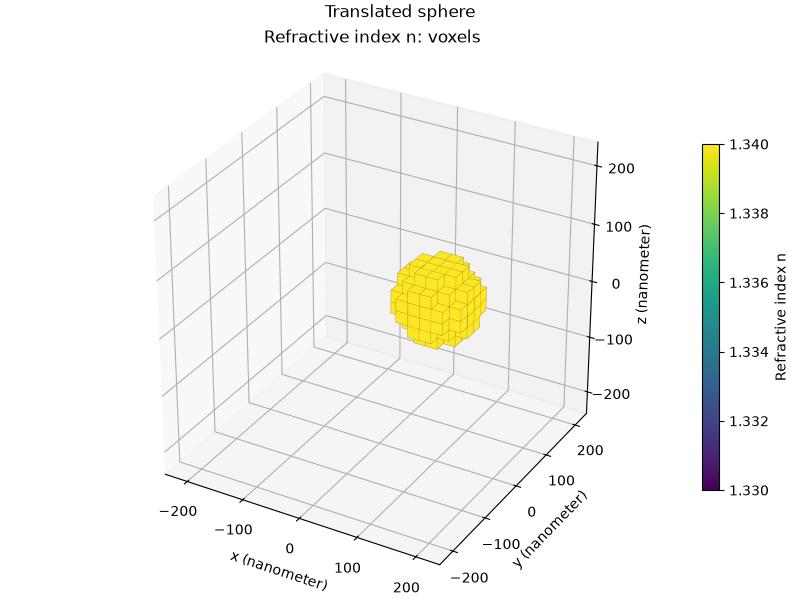
Translated sphere in 3D#
Show one finite input sample with its physical spatial axes.
preview_volume = volumes_by_arrangement["Translated sphere"]

medium_figure = preview_volume.plot_3d(
    backend="matplotlib",
    mode="voxels",
    field="refractive_index",
)

medium_figure.suptitle("Translated sphere")

plt.show()
Nonoverlapping sphere pair in 3D#
Show one finite input sample with its physical spatial axes.
preview_volume = volumes_by_arrangement["Nonoverlapping sphere pair"]

medium_figure = preview_volume.plot_3d(
    backend="matplotlib",
    mode="voxels",
    field="refractive_index",
)

medium_figure.suptitle("Nonoverlapping sphere pair")

plt.show()
Three-dimensional directional phase density#
Inspect the pair’s direction-space surface separately from the spatial slice and meridian comparisons above, without azimuth averaging.
phase_figure = pair_result.plot_phase_function(
    view="3d",
)

phase_figure.update_layout(title="Two-sphere first-order phase density · no azimuth averaging")

if "--no-browser" not in sys.argv:
    phase_figure.show(renderer="browser")
Total running time of the script: (0 minutes 6.404 seconds)