
Note
Go to the end to download the full example code.
Grid refinement against an exact cube integral#
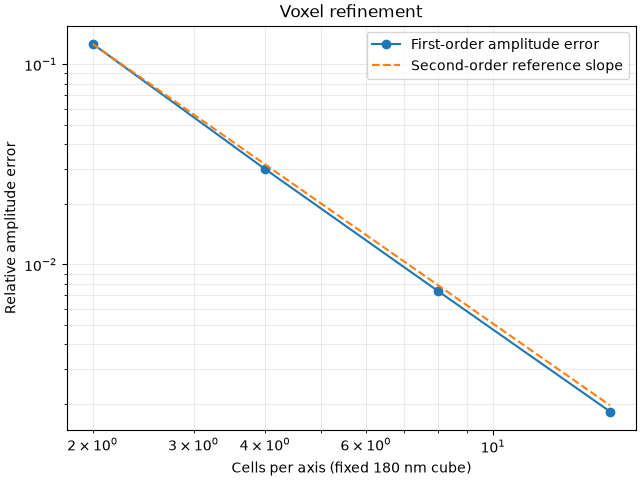
Refine a fixed physical cube rather than drawing a new random field on each grid. Its first-order amplitude has an independent closed-form reference, so this example isolates voxel midpoint-quadrature error. It does not test higher-order Green-tensor discretization or random-field synthesis.
import sys

import matplotlib.pyplot as plt
import numpy as np

from bornsim import Grid, Solver, Source, Volume
from bornsim.units import ureg
from bornsim import Directions

source = Source(wavelength=633 * ureg.nanometer)

solver = Solver(
    source=source,
    order=1,
)

side = 180 * ureg.nanometer

background = 1.33

delta_refractive_index = 0.01

direction = np.array([[1.0, 0.0, 0.0]])

k0 = 2 * np.pi / source.wavelength.to("meter").magnitude

length = side.to("meter").magnitude

q = background * k0 * (np.array([0.0, 0.0, 1.0]) - direction[0])

integral = length**3 * np.prod(np.sinc(q * length / (2 * np.pi)))

# Linearized dielectric contrast; y polarization is transverse to +x.
reference = k0**2 * (2 * background * delta_refractive_index) * integral / (4 * np.pi)

cells = np.array([2, 4, 8, 16])

relative_errors = []

observation_directions = Directions(vectors=direction)

for count in cells:
    grid = Grid(
        shape=(count,) * 3,
        spacing=side / count,
    )

    volume = Volume(
        delta_refractive_index=np.full((count,) * 3, delta_refractive_index),
        grid=grid,
        background_refractive_index=background,
    )

    result = solver.solve_cut(
        target=volume,
        directions=observation_directions,
    )

    amplitude = result.amplitudes.to("meter").magnitude[0, 0, 1, 1]

    relative_errors.append(abs(amplitude - reference) / abs(reference))

figure, axis = plt.subplots(layout="constrained")

axis.loglog(cells, relative_errors, "o-", label="First-order amplitude error")

axis.loglog(cells, relative_errors[0] * (cells[0] / cells) ** 2, "--", label="Second-order reference slope")

axis.set(xlabel="Cells per axis (fixed 180 nm cube)", ylabel="Relative amplitude error", title="Voxel refinement")

axis.grid(alpha=0.25, which="both")

axis.legend()

plt.show()
Inspect the medium in 3D#
Inspect the actual finite input sample with physical spatial axes. Drag to rotate and scroll to zoom in the embedded browser view. Regions with higher refractive index are more opaque; opacity is not absorption. This is the finest grid. The refractive index is constant throughout the sample; orthogonal slices show the uniform cube and its physical extent.
medium_figure = volume.plot_3d(
    mode="volume",
    field="refractive_index",
    opacity_scale="increasing",
)

if "--no-browser" not in sys.argv:
    medium_figure.show(renderer="browser")
Total running time of the script: (0 minutes 0.287 seconds)