Note
Go to the end to download the full example code
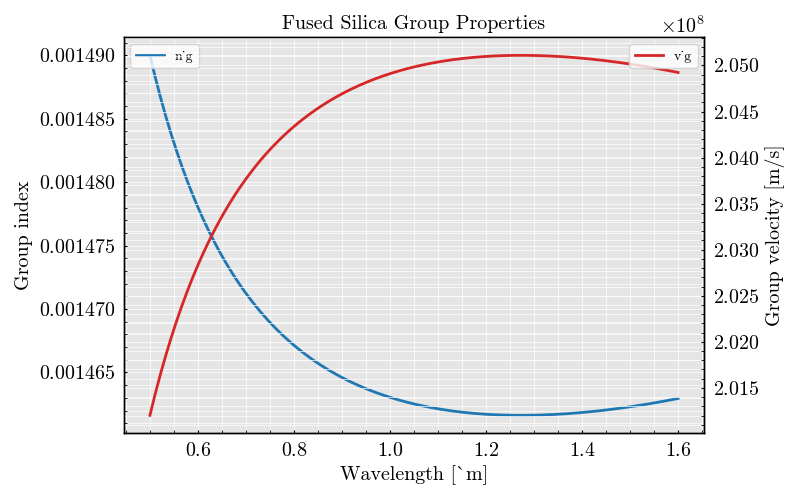
Group Index and Velocity of Fused Silica#
This example demonstrates how to compute and plot the group index and
group velocity of fused silica using PyOptik.
import numpy
import matplotlib.pyplot as plt
from MPSPlots.styles import mps
from TypedUnit import ureg

from PyOptik import MaterialBank


# Retrieve the material
material = MaterialBank.fused_silica

# Compute values over a wavelength range
wavelengths = numpy.linspace(0.5, 1.6, 200) * ureg.micrometer
n_g = material.compute_group_index(wavelengths)
v_g = material.compute_group_velocity(wavelengths)
with plt.style.context(mps):
    fig, ax1 = plt.subplots()

ax1.set(
    xlabel="Wavelength [µm]",
    ylabel="Group index",
    title="Fused Silica Group Properties",
)
ax1.plot(wavelengths.to(ureg.micrometer).magnitude, n_g.magnitude, label="n_g")
ax1.legend(loc="upper left")

ax2 = ax1.twinx()
ax2.set(ylabel="Group velocity [m/s]")
ax2.plot(
    wavelengths.to(ureg.micrometer).magnitude,
    v_g.to("m/s").magnitude,
    color="tab:red",
    label="v_g",
)
ax2.legend(loc="upper right")

plt.show()
Total running time of the script: (0 minutes 0.387 seconds)