Note
Go to the end to download the full example code
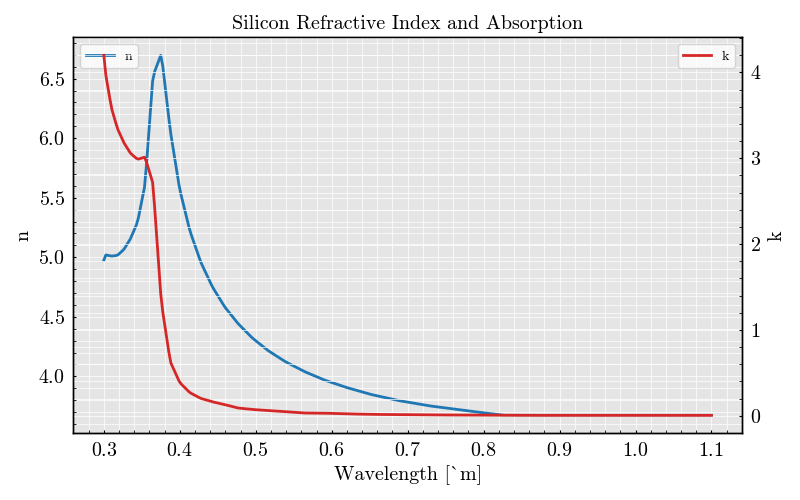
Plot the Refractive Index and Absorption of Silicon#
This example uses PyOptik to visualise both the real and
imaginary parts of the refractive index of silicon over a typical
infrared wavelength range.
import numpy
import matplotlib.pyplot as plt
from TypedUnit import ureg
from MPSPlots.styles import mps

from PyOptik import MaterialBank


material = MaterialBank.silicon

wavelengths = numpy.linspace(0.3, 1.1, 300) * ureg.micrometer
index = material.compute_refractive_index(wavelengths)
/opt/hostedtoolcache/Python/3.11.15/x64/lib/python3.11/site-packages/PyOptik/material/base_class.py:60: UserWarning: Wavelength range goes from 299.99999999999994 nanometer to 1.1 micrometer which is outside the allowable range of 206.6 nanometer to 826.5999999999999 nanometer µm. [Material: silicon]
  warnings.warn(
with plt.style.context(mps):
    fig, ax1 = plt.subplots()

ax1.set(
    title="Silicon Refractive Index and Absorption",
    xlabel="Wavelength [µm]",
    ylabel="n",
)
ax1.plot(wavelengths.to(ureg.micrometer).magnitude, index.real, label="n", color="tab:blue")
ax1.legend(loc="upper left")

ax2 = ax1.twinx()
ax2.set(ylabel="k")
ax2.plot(wavelengths.to(ureg.micrometer).magnitude, index.imag, color="tab:red", label="k")
ax2.legend(loc="upper right")

plt.show()
Total running time of the script: (0 minutes 0.369 seconds)