
Note
Go to the end to download the full example code.
Automated Backtesting with Bollinger Bands Strategy#
This example demonstrates how to use TradeTide’s Backtester class for automated strategy evaluation. The Backtester streamlines the entire workflow by handling position management, portfolio simulation, and performance analysis automatically.
We’ll test a Bollinger Bands strategy on 100 days of CAD/USD data to evaluate its historical performance and risk characteristics.
Import Libraries and Setup#
from TradeTide import Backtester, Strategy, Market, Currency
from TradeTide.times import months, days, hours, minutes
from TradeTide.indicators import BollingerBands
from TradeTide import capital_management, exit_strategy
Load Historical Market Data#
Load 100 days of CAD/USD forex data for comprehensive backtesting.
market = Market()

market.load_from_database(
    currency_0=Currency.CAD,
    currency_1=Currency.USD,
    time_span=20 * days,
)
# market.plot()
Configure Trading Strategy#
Set up a Bollinger Bands strategy with 2.0 standard deviation bands for more conservative signal generation.
indicator = BollingerBands(window=20 * minutes, multiplier=1.0)

indicator.run(market)

# indicator.plot()

strategy = Strategy()
strategy.add_indicator(indicator)
Define Risk Management#
Configure exit strategy and capital management parameters.
exit_strat = exit_strategy.Static(stop_loss=4, take_profit=4, save_price_data=True)

capital_mgmt = capital_management.FixedLot(
    capital=1_000,
    fixed_lot_size=100,
    max_capital_at_risk=100_000,
    max_concurrent_positions=10,
)
Run Backtest#
The Backtester automatically handles the complete workflow: strategy execution, position management, and performance calculation.
backtester = Backtester(
    strategy=strategy,
    exit_strategy=exit_strat,
    market=market,
    capital_management=capital_mgmt,
)

backtester.run()
backtester.print_summary()
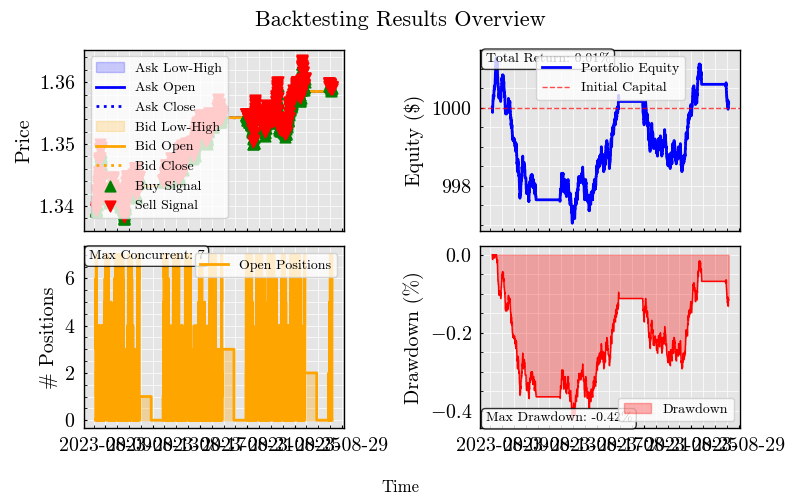
Display Results#
View comprehensive performance metrics and analysis.
backtester.plot()
findfont: Font family ['cursive'] not found. Falling back to DejaVu Sans.
findfont: Generic family 'cursive' not found because none of the following families were found: Apple Chancery, Textile, Zapf Chancery, Sand, Script MT, Felipa, Comic Neue, Comic Sans MS, cursive
findfont: Font family ['Arial'] not found. Falling back to DejaVu Sans.
findfont: Font family ['Arial'] not found. Falling back to DejaVu Sans.
findfont: Font family ['Arial'] not found. Falling back to DejaVu Sans.

<Figure size 640x480 with 4 Axes>
Total running time of the script: (1 minutes 48.460 seconds)