
Note
Go to the end to download the full example code.
Complete Trading Strategy Workflow with Bollinger Bands#
This comprehensive example demonstrates a complete end-to-end trading workflow using the TradeTide library. We’ll build a Bollinger Bands-based trading strategy, backtest it on historical CAD/USD data, and analyze the results.
The workflow covers: - Market data loading and visualization - Technical indicator configuration (Bollinger Bands) - Strategy setup and signal generation - Position management and risk controls - Portfolio simulation and performance analysis
This example is perfect for understanding how all TradeTide components work together to create a professional trading system.
Import Required Libraries#
We start by importing all necessary modules from TradeTide and standard libraries.
import matplotlib.pyplot as plt
import numpy as np
from TradeTide import Strategy, Portfolio, PositionCollection, Market, Currency
from TradeTide.times import days, hours, minutes

from TradeTide.indicators import BollingerBands
from TradeTide import capital_management, exit_strategy
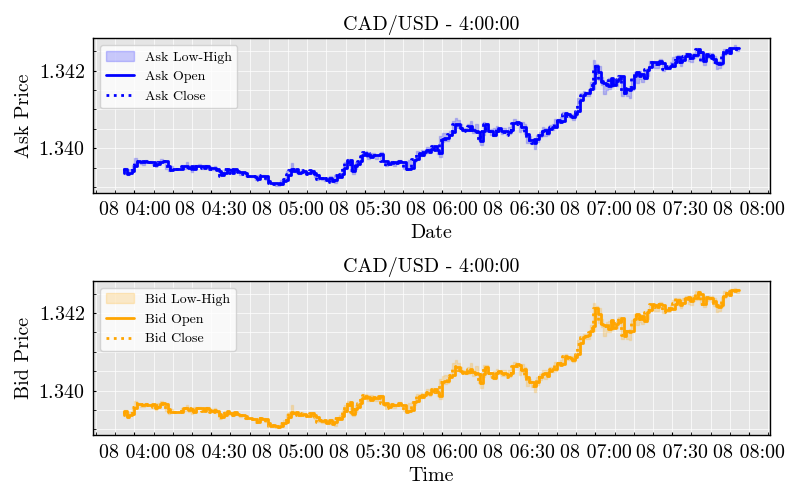
Load Market Data#
First, we load historical forex data for the CAD/USD currency pair. We’ll use 4 hours of data to demonstrate the strategy on recent market movements.
market = Market()

# Load 4 hours of CAD/USD data from the database
market.load_from_database(
    currency_0=Currency.CAD,
    currency_1=Currency.USD,
    time_span=4 * hours,
)

# Display basic market information
market.display()
Configure Bollinger Bands Indicator#
We’ll use Bollinger Bands as our primary technical indicator. Bollinger Bands consist of a moving average with upper and lower bands that expand and contract based on market volatility.
# Configure Bollinger Bands with 3-minute window and 1.0 standard deviation multiplier
indicator = BollingerBands(
    window=3 * minutes,  # Moving average window
    multiplier=1.0,  # Standard deviation multiplier for bands
)

# Run the indicator on our market data
indicator.run(market)
Build Trading Strategy#
Now we create a trading strategy that uses our Bollinger Bands indicator to generate buy and sell signals.
# Create strategy and add our indicator
strategy = Strategy()
strategy.add_indicator(indicator)

# Generate trading signals based on the strategy
trade_signals = strategy.get_trade_signal(market)
signal_count = np.count_nonzero(trade_signals)
Visualize Bollinger Bands and Market Data#
Let’s plot the Bollinger Bands to visualize the indicator behavior and understand where trading signals are generated.
# Create the indicator plot (shows only ask prices for clarity)
indicator.plot()

<Figure size 640x480 with 1 Axes>
Configure Risk Management#
Before opening positions, we need to set up our exit strategy and risk management parameters to control losses and secure profits.
# Set up static exit strategy with stop loss and take profit
risk_strategy = exit_strategy.Static(
    stop_loss=4,  # Stop loss at 4 pips
    take_profit=4,  # Take profit at 4 pips
    save_price_data=True,  # Save price data for analysis
)
Position Management#
Create and manage trading positions based on our strategy signals.
# Create position collection with our market data and trading signals
position_collection = PositionCollection(
    market=market,
    trade_signal=trade_signals,
)

position_collection.plot()

# Open positions based on signals and apply exit strategy
position_collection.open_positions(exit_strategy=risk_strategy)

# Propagate positions through time to simulate trading
position_collection.propagate_positions()
Capital Management Setup#
Configure capital management rules to control position sizing and overall risk.
# Configure fixed lot capital management
capital_mgmt = capital_management.FixedLot(
    capital=1_000_000,  # Starting capital: $1M
    fixed_lot_size=10_000,  # Fixed position size: $10K
    max_capital_at_risk=100_000,  # Maximum capital at risk: $100K
    max_concurrent_positions=100,  # Maximum concurrent positions: 100
)
Portfolio Simulation#
Run the complete portfolio simulation to see how our strategy performs.
# Create portfolio and run simulation
portfolio = Portfolio(position_collection=position_collection)
portfolio.simulate(capital_management=capital_mgmt)
Performance Analysis#
Analyze the results of our trading strategy and display key performance metrics.
# Get comprehensive performance metrics
metrics = portfolio.get_metrics()

# Display all performance metrics
metrics.display()
Total running time of the script: (0 minutes 0.687 seconds)