
Note
Go to the end to download the full example code.
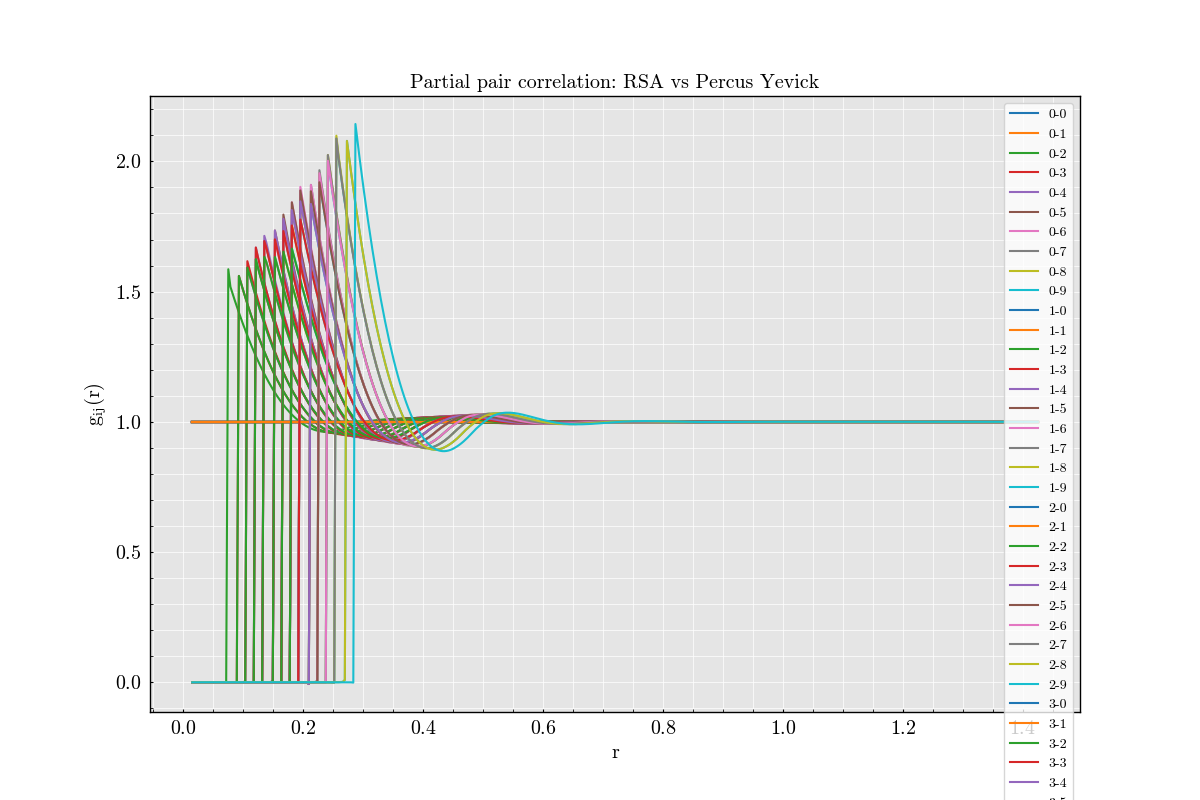
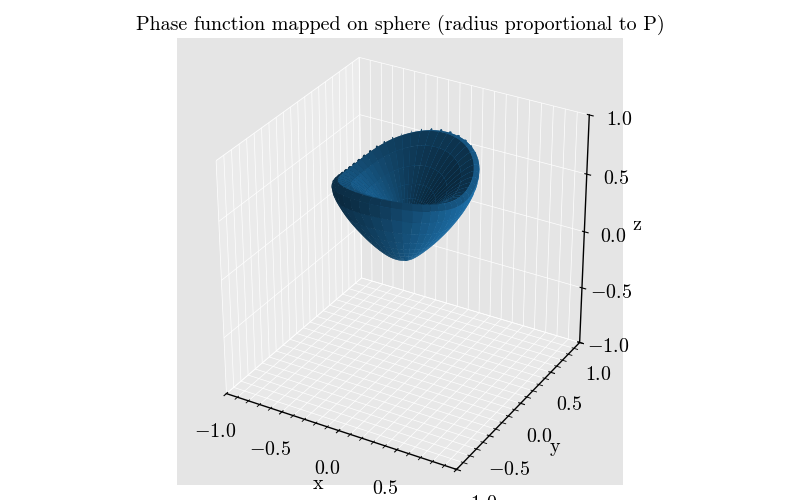
Scattering Example: Percus Yevick Structure Factor and Phase Function#
Example of Percus Yevick structure factor computation for a polydisperse mixture and corresponding phase function calculation.
import matplotlib.pyplot as plt
import numpy as np

from PackLab import analytical, samplers, scattering
from TypedUnit import ureg
from PackLab.units import ureg

sampler = samplers.Normal(
    mean=100 * ureg.nanometer,
    standard_deviation=10 * ureg.nanometer,
    bins=10
)

particle_radii, number_fractions = sampler.to_bins()

py_domain = analytical.PYDomain(
    size=100 * ureg.micrometer,
    radii=particle_radii,
    volume_fraction=0.24,
    number_fractions=number_fractions,
)

py_domain.print_bins()

# Percus Yevick solver radial frequency grid
# Because we want to plot g we need to have a large p_max to capture the oscillations at small r. The p_max should be at least 10 times 2*pi/r_min, where r_min is the smallest particle radius.
p_max = 1e3 / py_domain.radii.min()

p = np.linspace(0, p_max * 1, 2 * 60_000)

solver = analytical.Solver(
    densities=py_domain.particle_densities_per_radius,
    radii=py_domain.radii,
    p=p,
)

distances = np.linspace(
    py_domain.radii.min() * 2,
    py_domain.radii.max() * 10,
    400,
)

py_result = solver.compute(distances=distances)

fig, ax = plt.subplots(1, 1, figsize=(12, 8))

K = len(particle_radii)
for i in range(K):
    for j in range(K):
        ax.plot(py_result.distances.to('micrometer'), py_result.g[i, j], linewidth=1.5, label=f'{i}-{j}')


ax.set_xlabel("r")
ax.set_ylabel(r"$g_{ij}(r)$")
ax.set_title("Partial pair correlation: RSA vs Percus Yevick")
ax.legend()
plt.show()


datas = scattering.get_s1s2(
    wavelength=150 * ureg.nanometer,
    diameters=py_result.radii,
    material=1.45,
    medium=1.0,
    phi=np.linspace(-np.pi / 2, np.pi / 2, 400) * ureg.radian,
    polarization=0 * ureg.degree,
)

datas.process()


phi, theta, phase_function = datas.get_phase_function(
    densities=py_result.densities,
    H=py_result.H,
    p=py_result.p,
    theta_points=150
)


fig1 = scattering.plottings.plot_phase_function_3d(
    phi=phi,
    theta=theta,
    phase_function=phase_function.to('1 / meter').magnitude,
    mode="spherical"
)

plt.show()
Total running time of the script: (1 minutes 31.474 seconds)