Note
Go to the end to download the full example code.
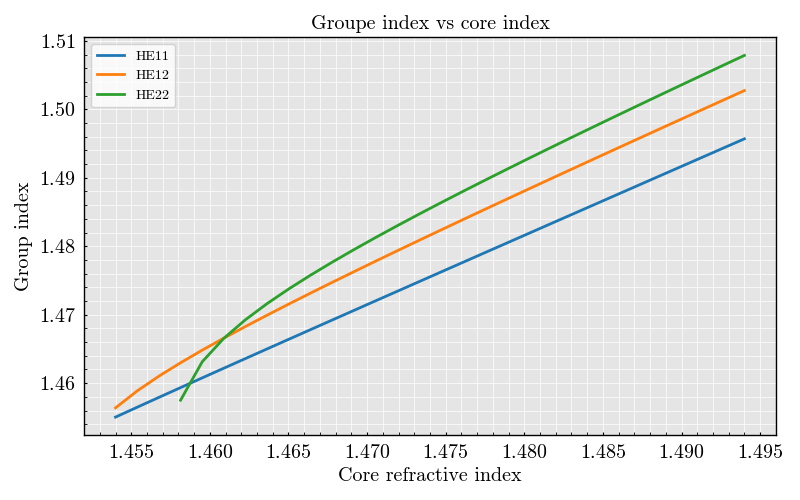
Groupe index VS core index#
Imports#
from PyFiberModes import FiberFactory, HE11, HE12, HE22
import matplotlib.pyplot as plt
import numpy
Generating the fiber structures#
Here we create the different fiber design that we want to explore
core_indexes = numpy.linspace(1.454, 1.494, 30)
factory = FiberFactory(wavelength=1550e-9)
factory.add_layer(name="core", radius=7e-6, index=core_indexes)
factory.add_layer(name="cladding", index=1.4444)
Preparing the figure
figure, ax = plt.subplots(1, 1)

ax.set(
    title='Groupe index vs core index',
    xlabel='Core refractive index',
    ylabel='Group index'
)

for mode in [HE11, HE12, HE22]:
    neff = []
    for fiber in factory:
        effective_index = fiber.get_group_index(mode)
        neff.append(effective_index)

    ax.plot(core_indexes, neff, label=str(mode))

plt.legend()
plt.show()


# -
Total running time of the script: (0 minutes 1.049 seconds)