Note
Go to the end to download the full example code.
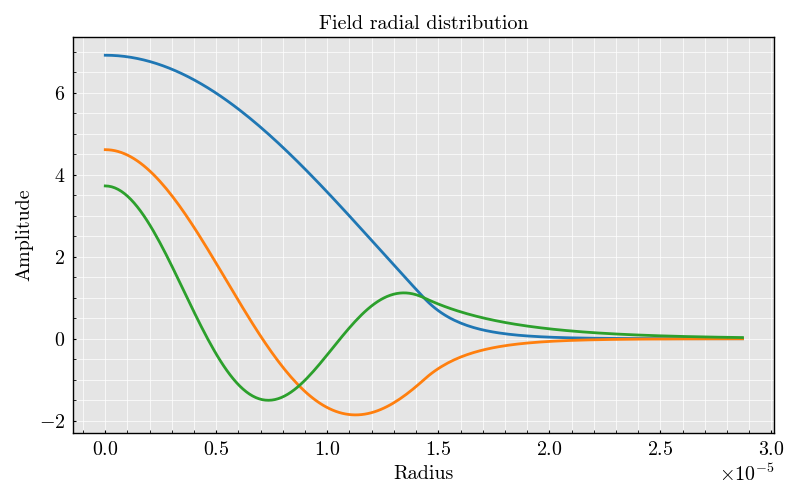
Mode fields#
Imports#
import numpy

from PyFiberModes import LP01, LP02, LP03
from PyFiberModes.fiber import load_fiber
import matplotlib.pyplot as plt
Generating the fiber structures#
Here we create the different fiber design that we want to explore
fiber = load_fiber(fiber_name='SMF28', wavelength=1550e-9)
fiber = fiber.scale(3.5)
Preparing the figure
radius_list = numpy.linspace(0, 2 * fiber.radius, 200)


figure, ax = plt.subplots(1, 1)

ax.set(
    title='Field radial distribution',
    xlabel='Radius',
    ylabel='Amplitude'
)

for mode in [LP01, LP02, LP03]:
    amplitudes = []
    for radius in radius_list:
        e_field, _ = fiber.get_radial_field(mode=mode, radius=radius)
        amplitudes.append(e_field.rho)

    amplitudes = numpy.asarray(amplitudes)
    amplitudes /= numpy.sign(amplitudes[0])
    plt.plot(radius_list, amplitudes, label=str(mode))


plt.show()

# -
Total running time of the script: (0 minutes 0.800 seconds)