Note
Go to the end to download the full example code
Create and export a measured material#
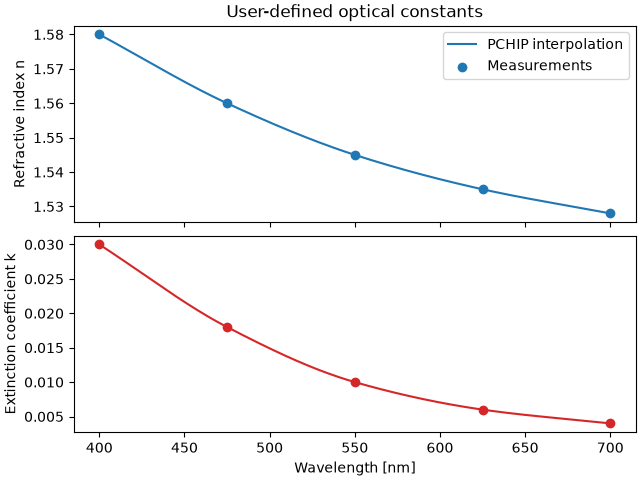
This example builds a complex refractive-index model from measured arrays, evaluates the interpolation, and verifies a YAML export/reload round trip.
from tempfile import TemporaryDirectory

import matplotlib.pyplot as plt
import numpy
from TypedUnit import ureg

from PyOptik import TabulatedMaterial


wavelength_samples = numpy.array([400, 475, 550, 625, 700]) * ureg.nanometer
measured_n = [1.58, 1.56, 1.545, 1.535, 1.528]
measured_k = [0.030, 0.018, 0.010, 0.006, 0.004]

material = TabulatedMaterial.from_arrays(
    "measured-film",
    wavelength_samples,
    n=measured_n,
    k=measured_k,
    interpolation="pchip",
    reference="Illustrative ellipsometry dataset",
    conditions={"temperature": "293 K"},
)
Exported files use the same validated schema as catalog materials.
with TemporaryDirectory() as directory:
    path = material.to_yaml(f"{directory}/measured-film.yml")
    restored = TabulatedMaterial("measured-film", file_path=path, interpolation="pchip")
    assert restored.reference == material.reference
wavelengths = numpy.linspace(400, 700, 301) * ureg.nanometer
index = material.compute_refractive_index(wavelengths, out_of_range="raise")

figure, (axis_n, axis_k) = plt.subplots(2, 1, sharex=True, layout="constrained")
axis_n.plot(wavelengths.magnitude, index.real, label="PCHIP interpolation")
axis_n.scatter(wavelength_samples.magnitude, measured_n, label="Measurements")
axis_n.set(ylabel="Refractive index n", title="User-defined optical constants")
axis_n.legend()

axis_k.plot(wavelengths.magnitude, index.imag, color="tab:red")
axis_k.scatter(wavelength_samples.magnitude, measured_k, color="tab:red")
axis_k.set(xlabel="Wavelength [nm]", ylabel="Extinction coefficient k")

plt.show()
Total running time of the script: (0 minutes 0.194 seconds)