
Note
Go to the end to download the full example code.
Fast Candlestick Charts#
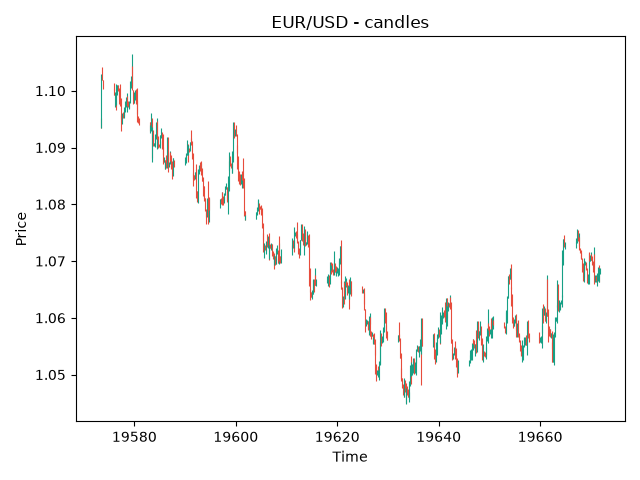
TradeTide draws candles with a small number of Matplotlib collections instead of creating one artist per bar. This makes the visualisation practical for large intraday datasets. By default, the renderer aggregates data to no more than 2,000 visible candles while preserving each bucket’s OHLC values.
Load a bundled market and render the ask side. Pass max_candles=None to
display every observation, or lower it further for fast interactive views.
from TradeTide import Currency, Market
from TradeTide.times import days

market = Market()
market.load_from_database(Currency.EUR, Currency.USD, time_span=100 * days)
market.plot_candles(side="ask", max_candles=500)
<Figure size 640x480 with 1 Axes>
Total running time of the script: (0 minutes 0.531 seconds)