
Note
Go to the end to download the full example code.
Non-Maximum Suppression for Gaussian Pulse Detection#
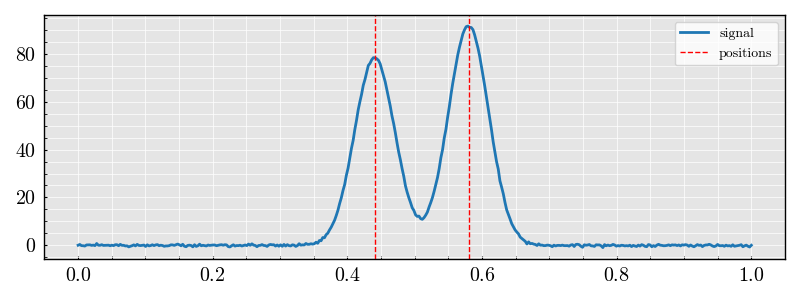
This example demonstrates the use of the NonMaximumSuppression class to detect Gaussian pulses in a one-dimensional signal. It generates a synthetic dataset of Gaussian pulses, applies the non-maximum suppression algorithm, and plots the results.
from DeepPeak.algorithms import NonMaximumSuppression
from DeepPeak.algorithms import ClosedFormSolver
from DeepPeak.signals import SignalDatasetGenerator
from DeepPeak import kernel
NUM_PEAKS = 4
SEQUENCE_LENGTH = 400
NSAMPLES = 4
gaussian_width = 0.03
kernel = kernel.Lorentzian(
amplitude=(50, 100), # Amplitude range
position=(0.1, 0.9), # Peak position range
width=gaussian_width, # Width range
)
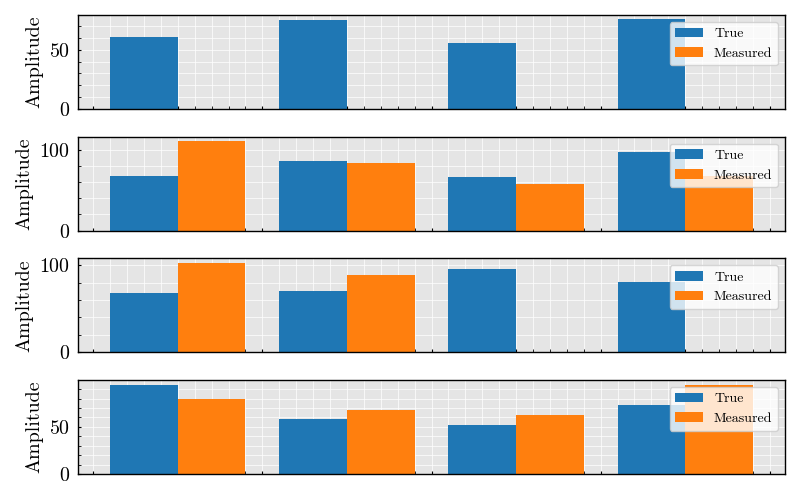
generator = SignalDatasetGenerator(n_samples=NSAMPLES, sequence_length=SEQUENCE_LENGTH)
dataset = generator.generate(
kernel=kernel,
n_peaks=NUM_PEAKS,
noise_std=0.3, # Add some noise
categorical_peak_count=False,
)
dataset.plot()
<Figure size 800x900 with 3 Axes>
Configure and run the detector
peak_locator = NonMaximumSuppression(
    gaussian_sigma=0.003,
    threshold="auto",
    maximum_number_of_pulses=NUM_PEAKS,
    kernel_truncation_radius_in_sigmas=3,
)

batched_peak_detector = peak_locator.run_batch(time_samples=dataset.x_values, signal=dataset.signals)

batched_peak_detector.plot()
<Figure size 650x1120 with 4 Axes>
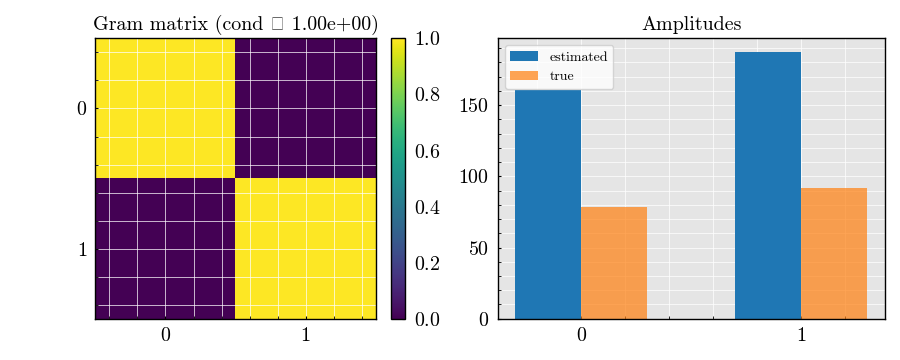
Solve for amplitudes
solver = ClosedFormSolver(sigma=dataset.widths.mean().squeeze())

result = solver.run_batch(centers=batched_peak_detector.peak_times, center_samples=batched_peak_detector.peak_amplitude_raw)

result.compare_plot(true_amplitudes=dataset.amplitudes)
<Figure size 800x500 with 4 Axes>
Total running time of the script: (0 minutes 1.300 seconds)