
Note
Go to the end to download the full example code.
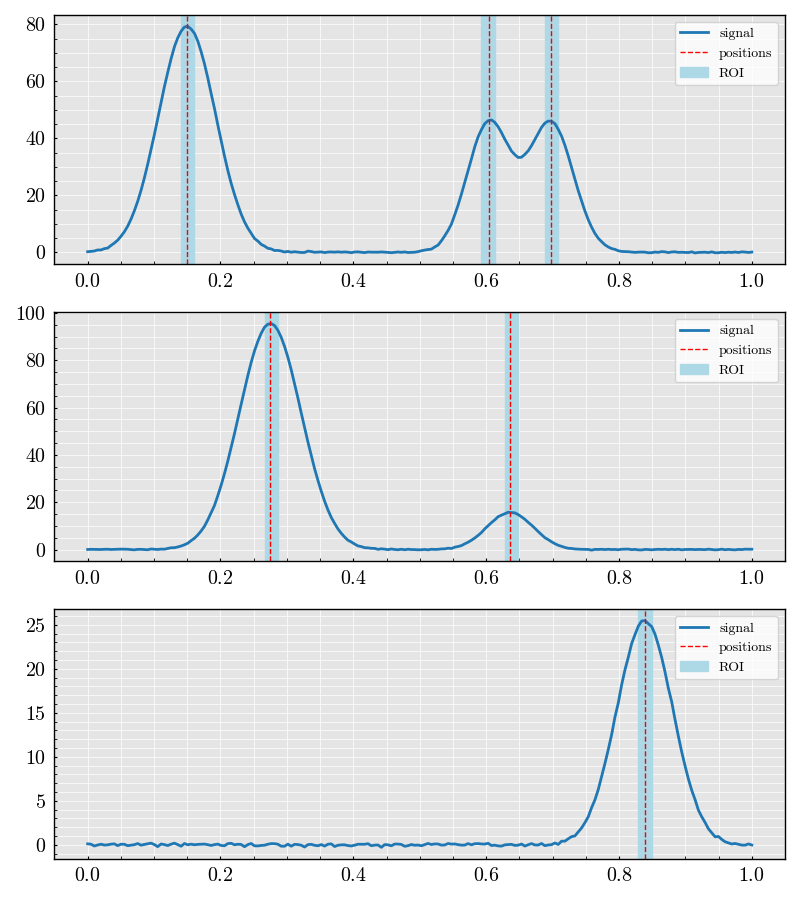
Generating and Visualizing Signal Data#
- This example demonstrates how to:
Generate synthetic signals with up to 3 Gaussian pulses.
Compute a Region of Interest (ROI) mask based on pulse positions.
Visualize signals with peak positions, amplitudes, and the ROI mask.
Imports#
from DeepPeak.signals import SignalDatasetGenerator
from DeepPeak import kernel
Generate Synthetic Signal Dataset#
We generate a dataset with NUM_PEAKS Gaussian pulses per signal. The peak amplitudes, positions, and widths are randomly chosen within specified ranges.
NUM_PEAKS = 3
SEQUENCE_LENGTH = 200
sample_count = 12

generator = SignalDatasetGenerator(n_samples=sample_count, sequence_length=SEQUENCE_LENGTH)

kernel = kernel.Lorentzian(
    amplitude=(10, 300),  # Amplitude range
    position=(0.3, 0.7),  # Peak position range
    width=0.02,
)

dataset = generator.generate(
    kernel=kernel,
    n_peaks=(3, 3),
    noise_std=0,  # Add some noise
    categorical_peak_count=False,
)

dataset.plot(number_of_columns=3, number_of_samples=9)
<Figure size 2400x900 with 9 Axes>
Total running time of the script: (0 minutes 0.992 seconds)