
Note
Go to the end to download the full example code.
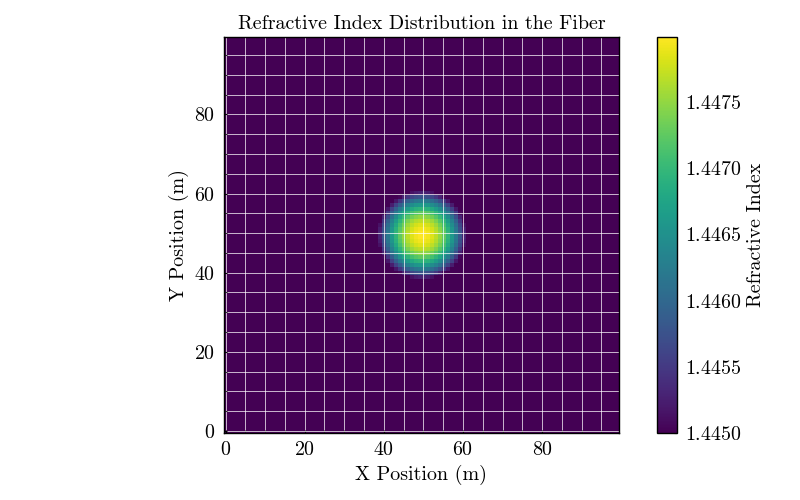
Loading and plotting a graded-index fiber structure#
from FiberFusing.fiber import GenericFiber
from FiberFusing.coordinate_system import CoordinateSystem
from FiberFusing import GradedIndex

fiber = GenericFiber()

fiber.create_and_add_new_structure(
    name='cladding',
    refractive_index=1.4450,
    radius=62.5 * 1e-6
)

graded_index = GradedIndex(
    inside=1.4480,
    outside=1.4450
)

fiber.create_and_add_new_structure(
    name='core',
    refractive_index=graded_index,
    radius=4.5 * 1e-6
)

coordinate_system = CoordinateSystem(
    nx=100,
    ny=100,
    x_min=-20e-6,
    x_max=20e-6,
    y_min=-20e-6,
    y_max=20e-6,
)

mesh = fiber.get_raster_mesh(coordinate_system=coordinate_system)

import matplotlib.pyplot as plt
plt.imshow(mesh, origin='lower', cmap='viridis')
plt.colorbar(label='Refractive Index')
plt.title('Refractive Index Distribution in the Fiber')
plt.xlabel('X Position (m)')
plt.ylabel('Y Position (m)')
plt.show()
Total running time of the script: (0 minutes 0.373 seconds)