
Note
Go to the end to download the full example code.
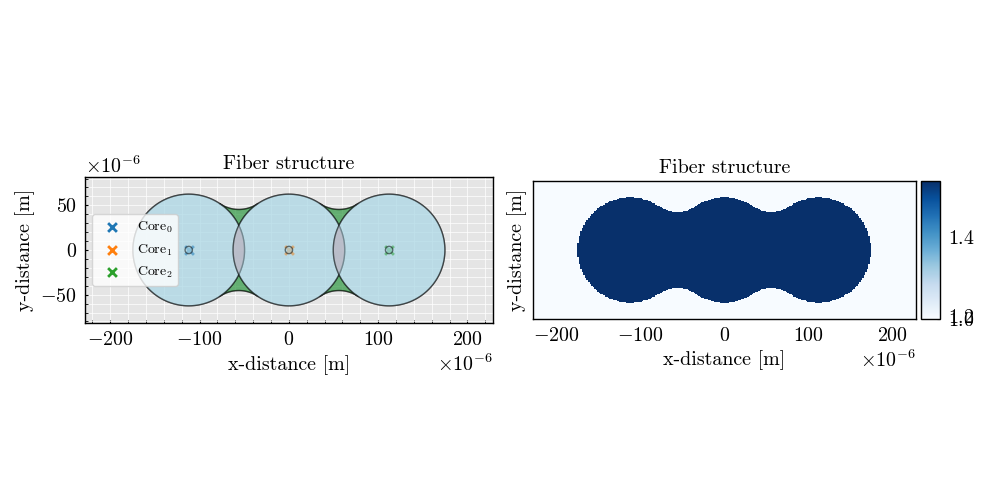
3x3 Line - Geometry Visualization#
This script demonstrates how to create and visualize a 3x3 line geometry using the FiberFusing library.
from FiberFusing import Geometry, DomainAlignment, BackGround
from FiberFusing.fiber import FiberLoader
from FiberFusing.profile import Profile, StructureType
Set up the background medium (air)
air_background = BackGround(refractive_index=1.0)
Create the cladding structure based on the fused fiber profile
profile = Profile()

profile.add_structure(
    structure_type=StructureType.LINEAR,
    number_of_fibers=3,
    fusion_degree=0.3,
    fiber_radius=62.5e-6
)

profile.refractive_index = 1.4444
Load fibers (e.g., SMF-28) positioned at the cores of the cladding structure
fiber_loader = FiberLoader()
fibers = [
    fiber_loader.load_fiber('SMF28', clad_refractive_index=profile.refractive_index, position=core_position)
    for core_position in profile.cores
]
Set up the geometry with the defined background, cladding structure, and resolution
geometry = Geometry(
    x_bounds=DomainAlignment.CENTERING,
    y_bounds=DomainAlignment.CENTERING,
    resolution=250
)
Add the fibers to the geometry
geometry.add_structure(air_background, profile, *fibers)

geometry.initialize()
Plot the resulting geometry
geometry.plot()
<Figure size 800x500 with 3 Axes>
Total running time of the script: (0 minutes 2.632 seconds)