
Note
Go to the end to download the full example code.
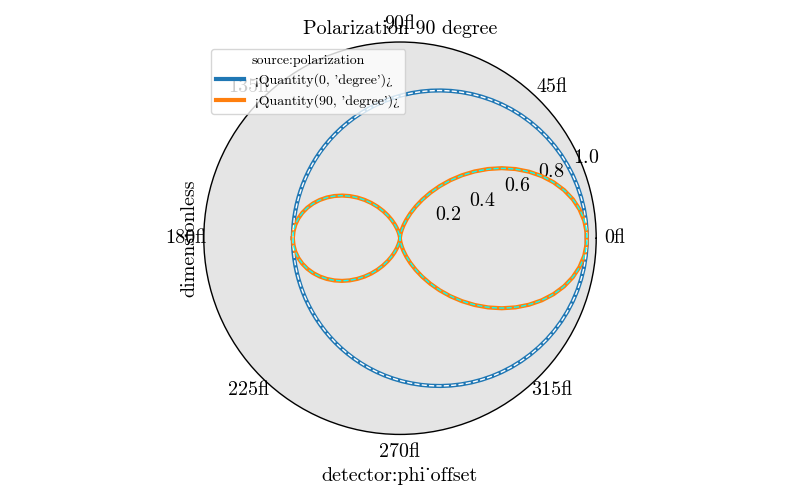
Goniometric Coupling vs S1 S2 Comparison#
import numpy as np
import matplotlib.pyplot as plt
from PyMieSim.units import ureg
from PyMieSim import single, experiment
from PyMieSim.polarization import PolarizationState

# Setup parameters
scatterer_diameter = 0.3 * ureg.micrometer  # Diameter of the scatterer in meters
scatterer_index = 1.4  # Refractive index of the scatterer
source_wavelength = 1.2 * ureg.micrometer  # Wavelength of the source in meters

source = experiment.source_set.GaussianSet(
    wavelength=[1.2] * ureg.micrometer,
    polarization=experiment.polarization_set.PolarizationSet(angles=[0, 90] * ureg.degree),
    optical_power=[1] * ureg.watt,
    numerical_aperture=[0.2],
)

scatterer = experiment.scatterer_set.SphereSet(
    diameter=scatterer_diameter,
    material=scatterer_index,
    medium=[1.0],
)

detector = experiment.detector_set.PhotodiodeSet(
    numerical_aperture=[0.1],
    phi_offset=np.linspace(-180, 180, 100) * ureg.degree,
    gamma_offset=[0.0] * ureg.degree,
    sampling=[1000]
)

# Configure experiment
experiment = experiment.Setup(scatterer_set=scatterer, source_set=source, detector_set=detector)

# Gather data
data_experiment = experiment.get("coupling", as_numpy=True)

data_experiment /= data_experiment.max()  # Normalize data

# Single scatterer simulation for S1 and S2
single_source = single.source.Gaussian(
    wavelength=source_wavelength,
    polarization=PolarizationState(angle=90 * ureg.degree),
    optical_power=1 * ureg.watt,
    numerical_aperture=0.2,
)

single_scatterer = single.scatterer.Sphere(
    diameter=scatterer_diameter,
    material=scatterer_index,
    medium=1.0,
)

single_setup = single.setup.Setup(
    scatterer=single_scatterer,
    source=single_source
)

s1s2 = single_setup.get_representation("s1s2", sampling=800)
phi, s1, s2 = s1s2.phi, np.abs(s1s2.S1) ** 2, np.abs(s1s2.S2) ** 2
s1 /= s1.max()  # Normalize S1 data
s2 /= s2.max()  # Normalize S2 data


figure, ax0 = plt.subplots(1, 1, subplot_kw=dict(projection="polar"))

ax0.plot(
    detector.phi_offset.to('radian').magnitude,
    data_experiment[0, :],
    linewidth=3
)

ax0.plot(
    detector.phi_offset.to('radian').magnitude,
    data_experiment[1, :],
    linewidth=3
)

ax0.plot(
    phi.to('radian').magnitude, s1, color="black", linestyle="--", linewidth=1, label="Computed S1"
)


ax0.plot(
    phi.to('radian').magnitude, s2, color="black", linestyle="--", linewidth=1, label="Computed S2"
)

plt.legend()

ax0.grid()

plt.show()
Total running time of the script: (0 minutes 0.216 seconds)