Note
Go to the end to download the full example code.
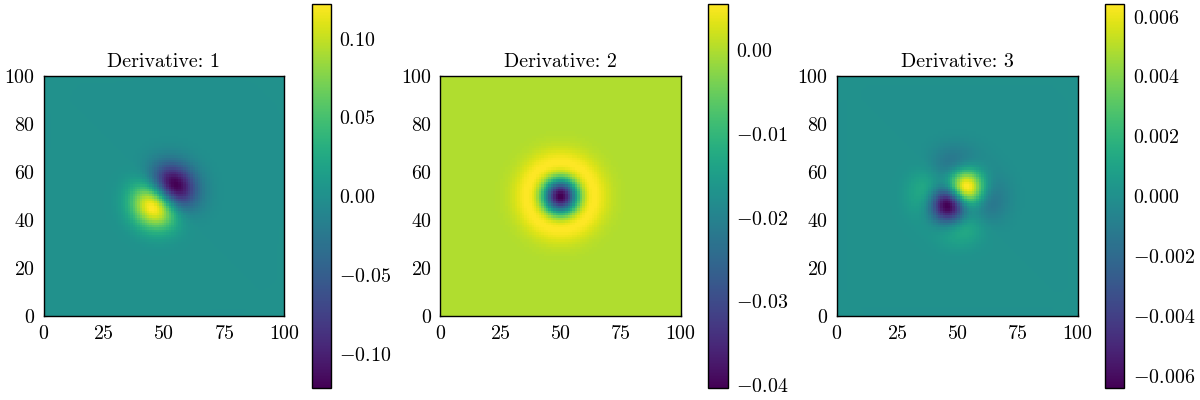
Gradient of array#
In this example, we calculate the gradient of a 2D array using finite difference methods. We will explore different orders of derivatives and visualize their effects on the input array.
Importing required packages#
Here we import the necessary libraries for numerical computations, rendering, and finite difference operations.
import numpy as np
from PyFinitDiff.finite_difference_2D import get_array_derivative, Boundaries
import matplotlib.pyplot as plt
from PyFinitDiff import BoundaryValue
Creating the input mesh#
We define a 2D Gaussian mesh using two 1D exponential arrays.
idx = np.linspace(-5, 5, 100)
x_array = np.exp(-idx**2)
y_array = np.exp(-idx**2)

y_array, x_array = np.meshgrid(x_array, y_array)

mesh = x_array * y_array
Setting boundary conditions#
Define boundary conditions for the gradient calculation. Here, we use ‘none’ for all boundaries.
boundaries = Boundaries(top=BoundaryValue.NONE, bottom=BoundaryValue.NONE, left=BoundaryValue.NONE, right=BoundaryValue.NONE)
Visualizing the gradient for different derivatives#
We compute the gradient for first, second, and third derivatives and visualize them.
figure, axes = plt.subplots(1, 3, figsize=(12, 4), constrained_layout=True)
axes = axes.flatten()

for ax, derivative in zip(axes, [1, 2, 3]):
    gradient = get_array_derivative(
        array=mesh,
        accuracy=6,
        derivative=derivative,
        x_derivative=True,
        y_derivative=True,
        boundaries=boundaries
    )

    image = ax.pcolormesh(gradient.real, shading='auto', cmap='viridis')
    ax.set_title(f'Derivative: {derivative}')
    ax.set_aspect('equal')
    plt.colorbar(image, ax=ax)

plt.show()
Total running time of the script: (0 minutes 7.018 seconds)