
Note
Go to the end to download the full example code.
Limit of Detection#
This example simulates the detection of small nanoparticles (50-150 nm diameter) in a flow cytometry setup using a dual-detector configuration (side and forward scatter). The simulation includes noise models, realistic fluidics, analog signal conditioning, digitization, triggering, and peak detection.
The main goal is to evaluate whether such particles produce detectable and distinguishable scatter signals in the presence of system noise and fluidic variability.
from FlowCyPy.units import ureg
from FlowCyPy import FlowCytometer
from FlowCyPy.fluidics import (
    distributions,
    FlowCell,
    Fluidics,
    ScattererCollection,
    populations,
)
from FlowCyPy.opto_electronics import (
    Detector,
    OptoElectronics,
    Digitizer,
    Amplifier,
    source,
    circuits,
)
from FlowCyPy.digital_processing import (
    DigitalProcessing,
    peak_locator,
    discriminator,
)
from matplotlib.ticker import FuncFormatter
Optical Source
source = source.Gaussian(
    waist_z=10 * ureg.micrometer,
    waist_y=60 * ureg.micrometer,
    wavelength=405 * ureg.nanometer,
    optical_power=100 * ureg.milliwatt,
)
Flow Cell Configuration
Define Scatterer Populations (50–150 nm spheres)
scatterer_collection = ScattererCollection()

for size in [150, 125, 100, 75, 50]:
    pop = populations.SpherePopulation(
        name=f"{size} nm",
        concentration=5e9 * ureg.particle / ureg.milliliter,
        diameter=distributions.Delta(value=size * ureg.nanometer),
        refractive_index=distributions.Delta(value=1.36),
        medium_refractive_index=1.33,
    )
    scatterer_collection.add_population(pop)

scatterer_collection.dilute(factor=100)

fluidics = Fluidics(scatterer_collection=scatterer_collection, flow_cell=flow_cell)

digitizer = Digitizer(
    bit_depth=14, use_auto_range=True, sampling_rate=60 * ureg.megahertz
)
Detectors
detector_side = Detector(
    name="side",
    phi_angle=90 * ureg.degree,
    numerical_aperture=0.2,
    responsivity=1 * ureg.ampere / ureg.watt,
    dark_current=0.1 * ureg.nanoampere,
)

detector_forward = Detector(
    name="forward",
    phi_angle=0 * ureg.degree,
    numerical_aperture=0.2,
    responsivity=1 * ureg.ampere / ureg.watt,
    dark_current=0.1 * ureg.nanoampere,
)
Opto-Electronics Processing Pipeline
amplifier = Amplifier(
    gain=10_000 * ureg.volt / ureg.ampere, bandwidth=10 * ureg.megahertz
)

analog_processing = [
    circuits.BesselLowPass(cutoff_frequency=0.4 * ureg.megahertz, order=4, gain=2),
    circuits.BaselineRestorationServo(time_constant=50 * ureg.microsecond),
]

opto_electronics = OptoElectronics(
    digitizer=digitizer,
    analog_processing=analog_processing,
    detectors=[detector_side, detector_forward],
    source=source,
    amplifier=amplifier,
)
Digital Processing Pipeline
discriminator = discriminator.FixedWindow(
    trigger_channel="side",
    threshold="4sigma",
    max_triggers=-1,
    pre_buffer=128,
    post_buffer=128,
)

digital_processing = DigitalProcessing(
    discriminator=discriminator,
    peak_algorithm=peak_locator.GlobalPeakLocator(),
)
Run the acquisition#
Simulate the nanoparticle mixture with the configured noise and processing.
cytometer = FlowCytometer(
    fluidics=fluidics,
    background_power=0.1 * ureg.nanowatt,
)

run_record = cytometer.run(
    run_time=10.0 * ureg.millisecond,
    digital_processing=digital_processing,
    opto_electronics=opto_electronics,
)
Plot Raw Analog Signal#
Zoom to the strongest triggered window so the pulse shape remains visible instead of compressing the entire 600,000-sample acquisition into a dense band.
digital_signal = run_record.signal.digital
analog_signal = run_record.signal.analog
plot_time_unit = run_record.run_time.to_compact().units
time_scale = (1 * plot_time_unit).to(ureg.microsecond).magnitude
time_window = None
plot_title = "Strongest signal (no triggered windows)"

if digital_signal is not None and not digital_signal.empty:
    strongest_segment = max(
        digital_signal.groupby(level="SegmentID"),
        key=lambda segment: segment[1]["side"].max(),
    )[1]
    segment_time_unit = digital_signal.attrs["units"]["Time"]
    segment_start = (
        strongest_segment["Time"].iloc[0] * segment_time_unit
    ).to(plot_time_unit).magnitude
    segment_end = (
        strongest_segment["Time"].iloc[-1] * segment_time_unit
    ).to(plot_time_unit).magnitude
    padding = (5 * ureg.microsecond).to(plot_time_unit).magnitude
    run_end = run_record.run_time.to(plot_time_unit).magnitude

    time_window = (max(0.0, segment_start - padding), min(run_end, segment_end + padding))
    plot_title = "Strongest triggered event and detector noise"
else:
    strongest_sample = analog_signal["side"].abs().idxmax()
    signal_time_unit = analog_signal.attrs["units"]["Time"]
    peak_time = (
        analog_signal.loc[strongest_sample, "Time"] * signal_time_unit
    ).to(plot_time_unit).magnitude
    padding = (5 * ureg.microsecond).to(plot_time_unit).magnitude
    run_end = run_record.run_time.to(plot_time_unit).magnitude

    time_window = (max(0.0, peak_time - padding), min(run_end, peak_time + padding))

figure = run_record.plot_analog(
    figure_size=(11, 6.5),
    xlim=time_window,
    include_scatterer=False,
)
figure.suptitle(plot_title, fontsize=13)

voltage_unit = format(run_record.signal.analog.signal_units, "~")

for axis, label in zip(figure.axes, ("SSC", "FSC")):
    axis.set_ylabel(f"{label} [{voltage_unit}]", fontsize=12, labelpad=8)
    axis.yaxis.set_label_position("left")
    axis.yaxis.set_ticks_position("left")
    axis.tick_params(labelsize=9)
    axis.grid(True, alpha=0.2)
    if axis.lines:
        axis.lines[0].set_linewidth(0.8)
        axis.lines[0].set_alpha(0.85)

for axis in figure.axes:
    axis.xaxis.set_major_formatter(
        FuncFormatter(lambda value, _: f"{value * time_scale:.1f}")
    )

figure.axes[-1].set_xlabel("Time [µs]", fontsize=12)

legend = figure.axes[0].get_legend()
if legend is not None:
    handles, _ = figure.axes[0].get_legend_handles_labels()
    legend.remove()
    figure.legend(
        handles,
        ["Analog signal", "4-sigma trigger threshold"],
        loc="upper center",
        bbox_to_anchor=(0.5, 0.93),
        ncol=2,
        frameon=False,
        fontsize=9,
    )

figure.tight_layout(rect=(0, 0, 1, 0.88))
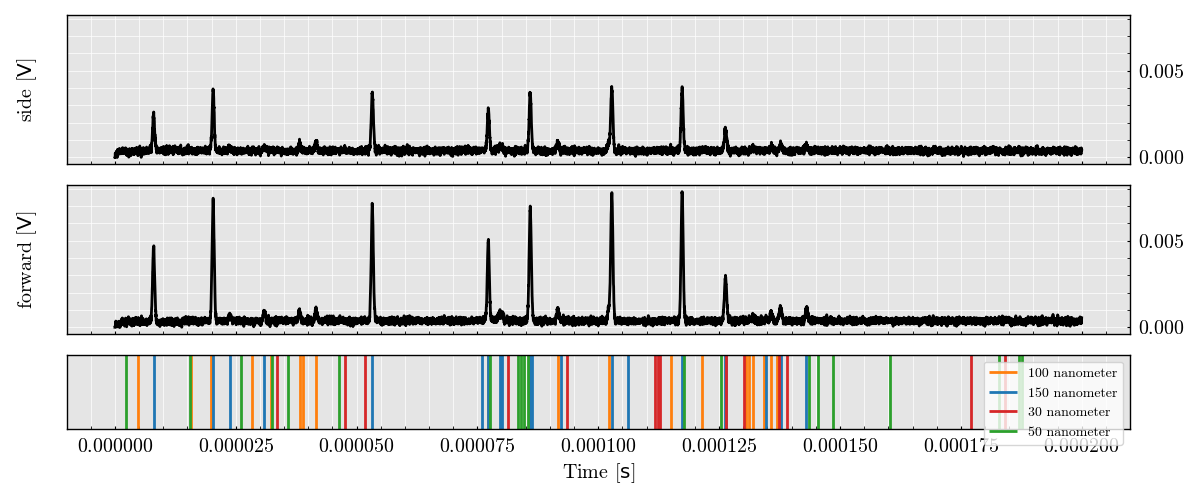
/opt/hostedtoolcache/Python/3.11.17/x64/lib/python3.11/site-packages/matplotlib/cbook.py:1355: UnitStrippedWarning: The unit of the quantity is stripped when downcasting to ndarray.
  return np.asarray(x, float)
Plot Triggered Analog Signal Segments#
Inspect which weak pulses survived the discriminator threshold.
run_record.plot_digital()
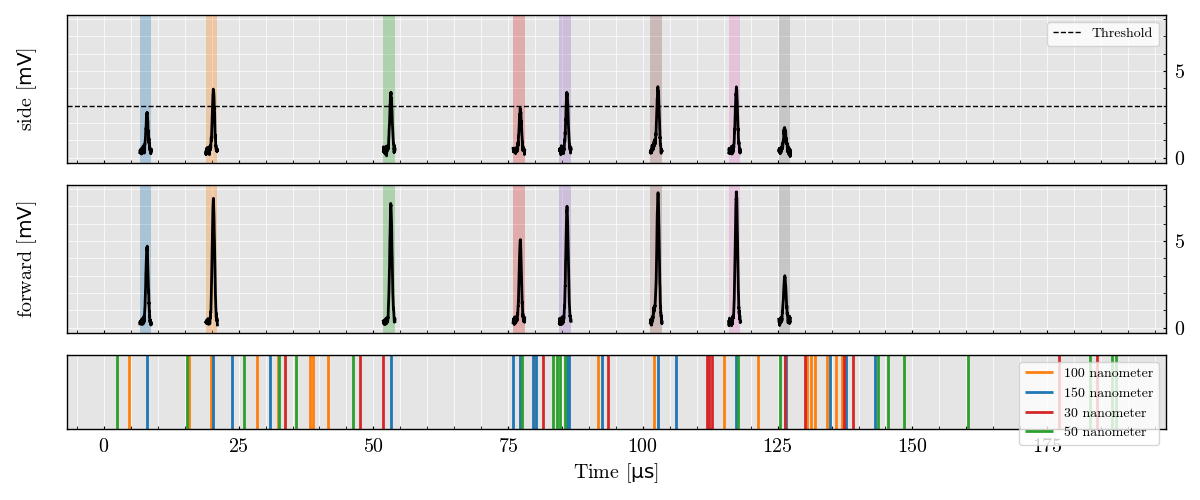
/opt/hostedtoolcache/Python/3.11.17/x64/lib/python3.11/site-packages/matplotlib/cbook.py:1044: UnitStrippedWarning: The unit of the quantity is stripped when downcasting to ndarray.
  x = np.asanyarray(x)

<Figure size 640x480 with 3 Axes>
Total running time of the script: (0 minutes 5.079 seconds)