
Note
Go to the end to download the full example code.
Threshold sensitivity#
This tutorial investigates how discriminator threshold affects event recovery for weak signals close to baseline noise.
from FlowCyPy.units import ureg
from FlowCyPy import FlowCytometer
from FlowCyPy.fluidics import (
    Fluidics,
    FlowCell,
    ScattererCollection,
    populations,
    distributions,
    SampleFlowRate,
    SheathFlowRate,
)
from FlowCyPy.opto_electronics import (
    Detector,
    Digitizer,
    OptoElectronics,
    Amplifier,
    source,
    circuits,
)
from FlowCyPy.digital_processing import (
    DigitalProcessing,
    discriminator,
    peak_locator,
)
Step 1: Build a weak-signal simulation#
flow_cell = FlowCell(
    sample_volume_flow=SampleFlowRate.MEDIUM.value,
    sheath_volume_flow=SheathFlowRate.MEDIUM.value,
    width=400 * ureg.micrometer,
    height=150 * ureg.micrometer,
)

scatterer_collection = ScattererCollection()

population = populations.SpherePopulation(
    name="Near-threshold population",
    medium_refractive_index=distributions.Delta(1.33),
    concentration=1e10 * ureg.particle / ureg.milliliter,
    diameter=distributions.RosinRammler(
        scale=100 * ureg.nanometer,
        shape=12,
    ),
    refractive_index=distributions.Normal(
        mean=1.40,
        standard_deviation=0.002,
        low_cutoff=1.33,
    ),
    sampling_method=populations.ExplicitModel(),
)

scatterer_collection.add_population(population)

scatterer_collection.dilute(100)

fluidics = Fluidics(
    scatterer_collection=scatterer_collection,
    flow_cell=flow_cell,
)

analog_processing = [
    circuits.BaselineRestorationServo(time_constant=10 * ureg.microsecond),
    circuits.BesselLowPass(cutoff_frequency=1 * ureg.megahertz, order=4, gain=2),
]

excitation_source = source.Gaussian(
    waist_z=10e-6 * ureg.meter,
    waist_y=60e-6 * ureg.meter,
    wavelength=405 * ureg.nanometer,
    optical_power=25 * ureg.milliwatt,
    rin=-140 * ureg.dB_per_Hz,
    bandwidth=10 * ureg.megahertz,
)

detectors = [
    Detector(
        name="side",
        phi_angle=90 * ureg.degree,
        numerical_aperture=1.1,
        responsivity=1 * ureg.ampere / ureg.watt,
    )
]

amplifier = Amplifier(
    gain=10 * ureg.volt / ureg.ampere,
    bandwidth=10 * ureg.megahertz,
    voltage_noise_density=0.001 * ureg.nanovolt / ureg.sqrt_hertz,
    current_noise_density=0.001 * ureg.femtoampere / ureg.sqrt_hertz,
)

digitizer = Digitizer(
    sampling_rate=60 * ureg.megahertz,
    bit_depth=14,
    use_auto_range=True,
    channel_range_mode="shared",
)

opto_electronics = OptoElectronics(
    digitizer=digitizer,
    detectors=detectors,
    source=excitation_source,
    amplifier=amplifier,
    analog_processing=analog_processing,
)

cytometer = FlowCytometer(
    fluidics=fluidics,
    background_power=0 * ureg.picowatt,
)
Step 2: Sweep discriminator threshold#
threshold_values = ["2sigma", "3sigma", "4sigma", "5sigma"]
run_records = []

for threshold_value in threshold_values:
    digital_processing = DigitalProcessing(
        discriminator=discriminator.DynamicWindow(
            trigger_channel="side",
            threshold=threshold_value,
            pre_buffer=40,
            post_buffer=40,
            max_triggers=-1,
        ),
        peak_algorithm=peak_locator.GlobalPeakLocator(),
    )

    run_record = cytometer.run(
        opto_electronics=opto_electronics,
        digital_processing=digital_processing,
        run_time=1 * ureg.millisecond,
    )

    run_records.append((threshold_value, run_record))


def plot_analog_window(run_record, threshold_value):
    figure = run_record.plot_analog(
        figure_size=(12, 4.5),
        include_scatterer=False,
    )
    analog_signal = run_record.signal.analog
    time_unit = analog_signal.attrs["units"]["Time"]
    window_end = (100 * ureg.microsecond).to(time_unit).magnitude
    detector_names = [column for column in analog_signal.columns if column != "Time"]

    for axis, detector_name in zip(figure.axes, detector_names):
        detector_label = {"side": "SSC", "forward": "FSC"}.get(
            detector_name, detector_name
        )
        voltage_unit = format(analog_signal.attrs["units"][detector_name], "~")
        axis.set_ylabel(f"{detector_label} [{voltage_unit}]", fontsize=10)
        axis.yaxis.set_label_position("left")
        axis.yaxis.set_ticks_position("left")
        axis.set_xlim(0, window_end)
        axis.tick_params(labelsize=9)
        axis.grid(True, alpha=0.2)
        if axis.lines:
            axis.lines[0].set_linewidth(0.8)

    legend = figure.axes[0].get_legend()
    if legend is not None:
        handles, labels = figure.axes[0].get_legend_handles_labels()
        legend.remove()
        figure.legend(
            handles,
            [
                "Analog signal" if "analog" in label.lower() else "Trigger threshold"
                for label in labels
            ],
            loc="upper center",
            bbox_to_anchor=(0.5, 0.94),
            ncol=len(handles),
            frameon=False,
            fontsize=9,
        )

    figure.suptitle(f"Analog signal at {threshold_value} threshold", fontsize=13)
    figure.axes[-1].set_xlabel(f"Time [{format(time_unit, '~')}]", fontsize=10)
    figure.tight_layout(rect=(0, 0, 1, 0.86))
    return figure


def plot_digital_window(run_record, threshold_value):
    figure = run_record.plot_digital(
        figure_size=(12, 4.5),
        include_scatterer=False,
    )
    digital_signal = run_record.signal.digital
    time_unit = digital_signal.attrs["units"]["Time"]
    window_end = (100 * ureg.microsecond).to(time_unit).magnitude

    for axis in figure.axes:
        axis.set_xlim(0, window_end)
        axis.yaxis.set_label_position("left")
        axis.yaxis.set_ticks_position("left")
        axis.tick_params(labelsize=9)
        axis.yaxis.label.set_size(10)
        axis.grid(True, alpha=0.2)

    figure.suptitle(f"Triggered segments at {threshold_value}", fontsize=13)
    figure.axes[-1].set_xlabel(f"Time [{format(time_unit, '~')}]", fontsize=10)
    figure.tight_layout(rect=(0, 0, 1, 0.9))
    return figure


def plot_peak_heights(run_record, threshold_value):
    figure = run_record.plot_peaks(
        x=("side", "Height"),
        figure_size=(8, 5),
        title=f"Side-scatter peak heights at {threshold_value}",
    )
    figure.tight_layout()
    return figure
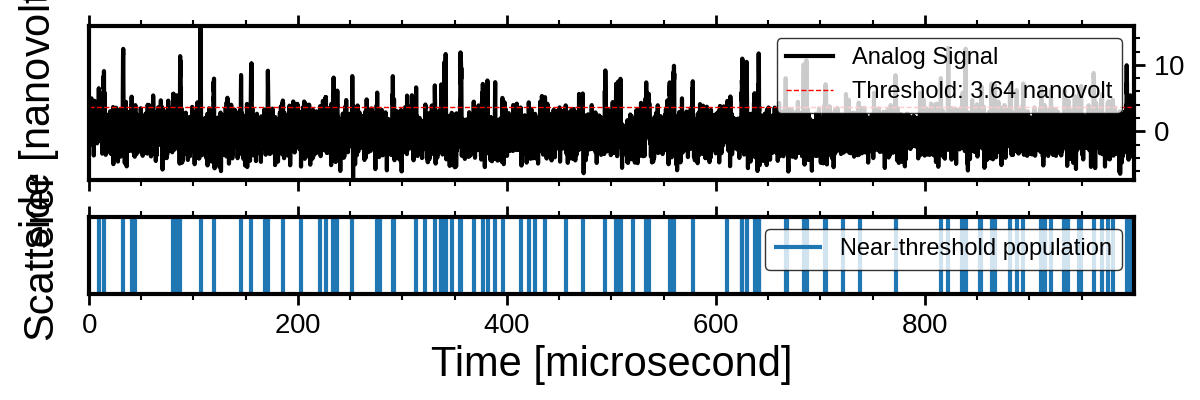
Analog signal at 2sigma#
Inspect the signal and baseline before reviewing the recovered events.
threshold_value, run_record = run_records[0]
_ = plot_analog_window(run_record, threshold_value)
/opt/hostedtoolcache/Python/3.11.17/x64/lib/python3.11/site-packages/matplotlib/cbook.py:1355: UnitStrippedWarning: The unit of the quantity is stripped when downcasting to ndarray.
  return np.asarray(x, float)
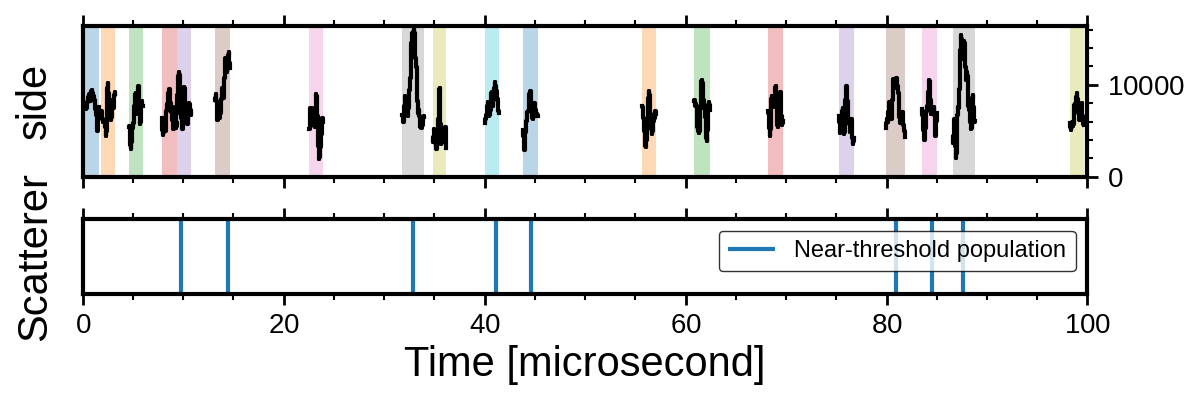
Triggered segments at 2sigma#
Inspect the first 0.1 milliseconds of triggered signal segments.
_ = plot_digital_window(run_record, threshold_value)
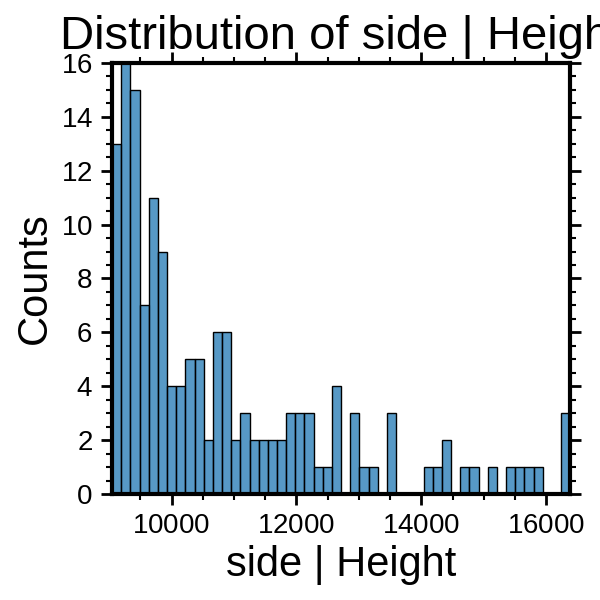
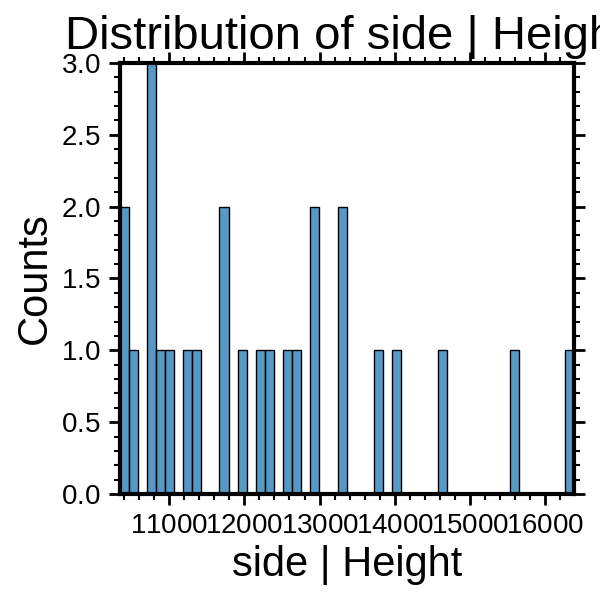
Peak heights at 2sigma#
Compare the recovered weak-event distribution as the threshold rises.
_ = plot_peak_heights(run_record, threshold_value)
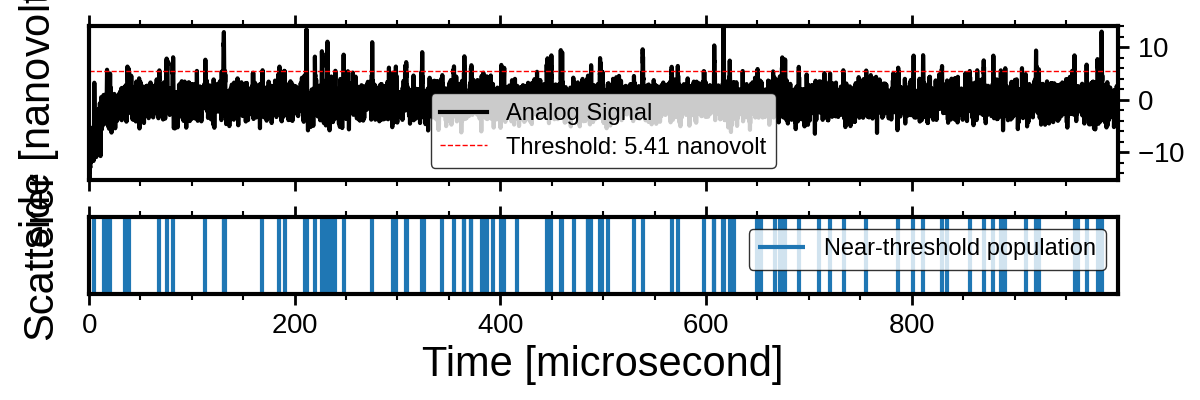
Analog signal at 3sigma#
Inspect the signal and baseline before reviewing the recovered events.
threshold_value, run_record = run_records[1]
_ = plot_analog_window(run_record, threshold_value)
/opt/hostedtoolcache/Python/3.11.17/x64/lib/python3.11/site-packages/matplotlib/cbook.py:1355: UnitStrippedWarning: The unit of the quantity is stripped when downcasting to ndarray.
  return np.asarray(x, float)
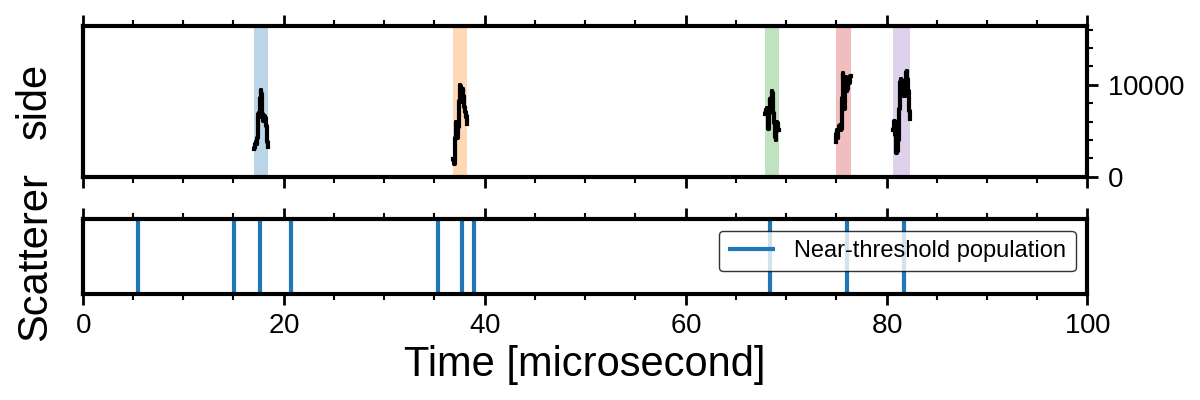
Triggered segments at 3sigma#
Inspect the first 0.1 milliseconds of triggered signal segments.
_ = plot_digital_window(run_record, threshold_value)
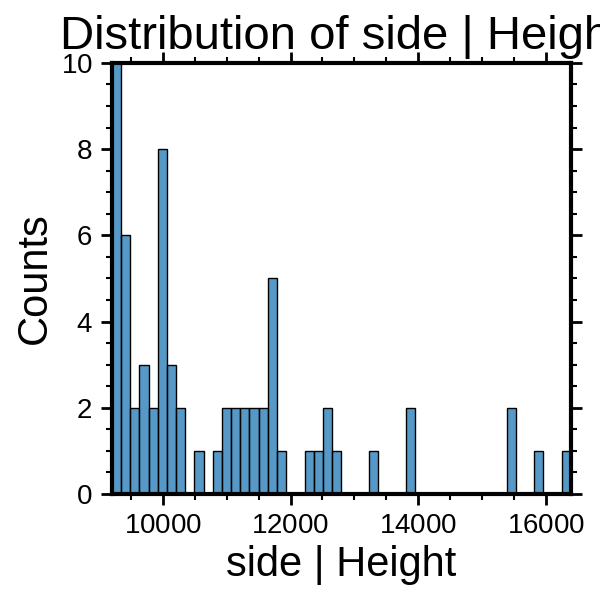
Peak heights at 3sigma#
Compare the recovered weak-event distribution as the threshold rises.
_ = plot_peak_heights(run_record, threshold_value)
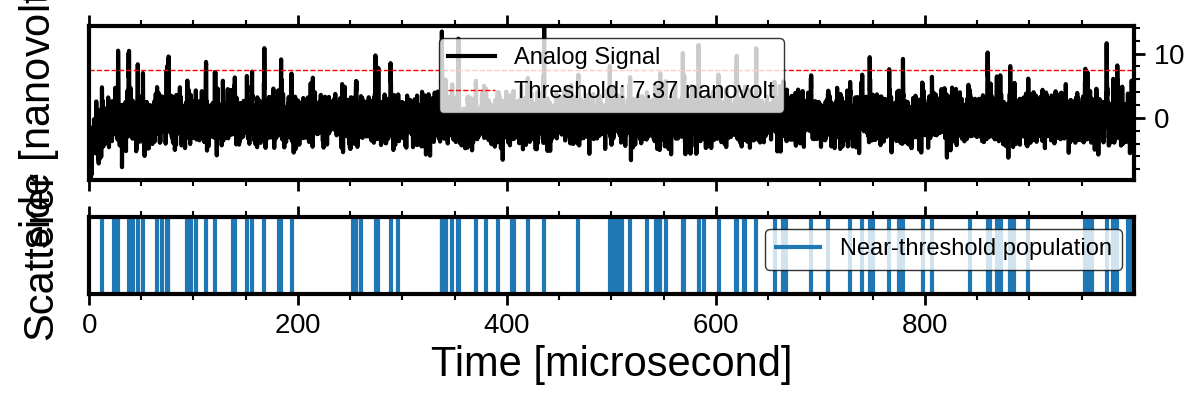
Analog signal at 4sigma#
Inspect the signal and baseline before reviewing the recovered events.
threshold_value, run_record = run_records[2]
_ = plot_analog_window(run_record, threshold_value)
/opt/hostedtoolcache/Python/3.11.17/x64/lib/python3.11/site-packages/matplotlib/cbook.py:1355: UnitStrippedWarning: The unit of the quantity is stripped when downcasting to ndarray.
  return np.asarray(x, float)
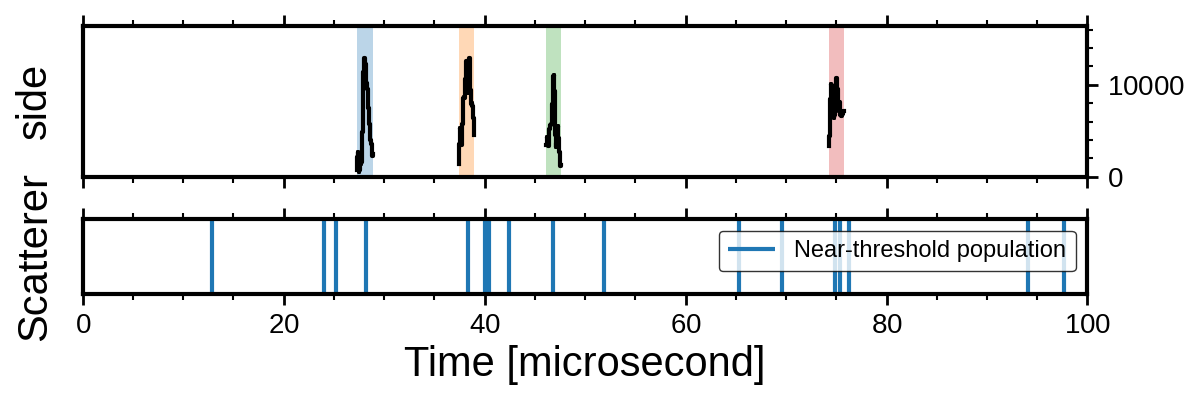
Triggered segments at 4sigma#
Inspect the first 0.1 milliseconds of triggered signal segments.
_ = plot_digital_window(run_record, threshold_value)
Peak heights at 4sigma#
Compare the recovered weak-event distribution as the threshold rises.
_ = plot_peak_heights(run_record, threshold_value)
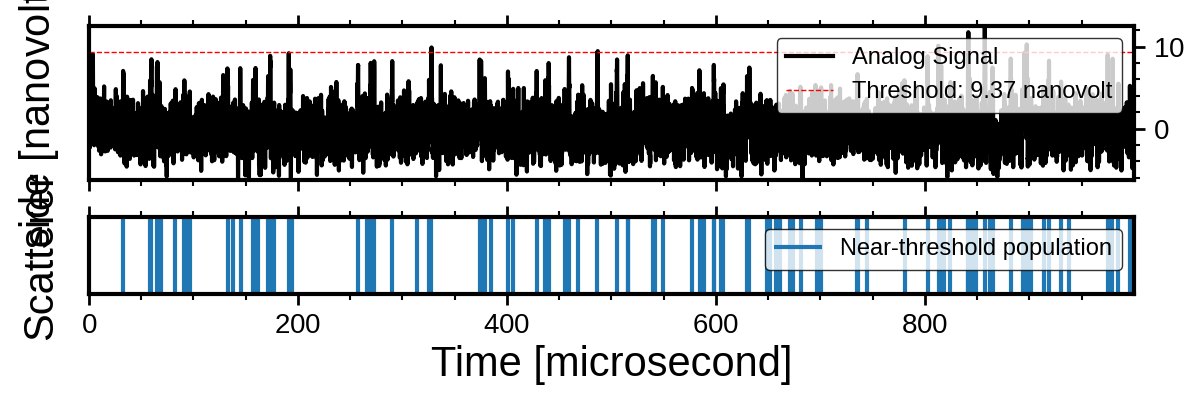
Analog signal at 5sigma#
Inspect the signal and baseline before reviewing the recovered events.
threshold_value, run_record = run_records[3]
_ = plot_analog_window(run_record, threshold_value)
/opt/hostedtoolcache/Python/3.11.17/x64/lib/python3.11/site-packages/matplotlib/cbook.py:1355: UnitStrippedWarning: The unit of the quantity is stripped when downcasting to ndarray.
  return np.asarray(x, float)
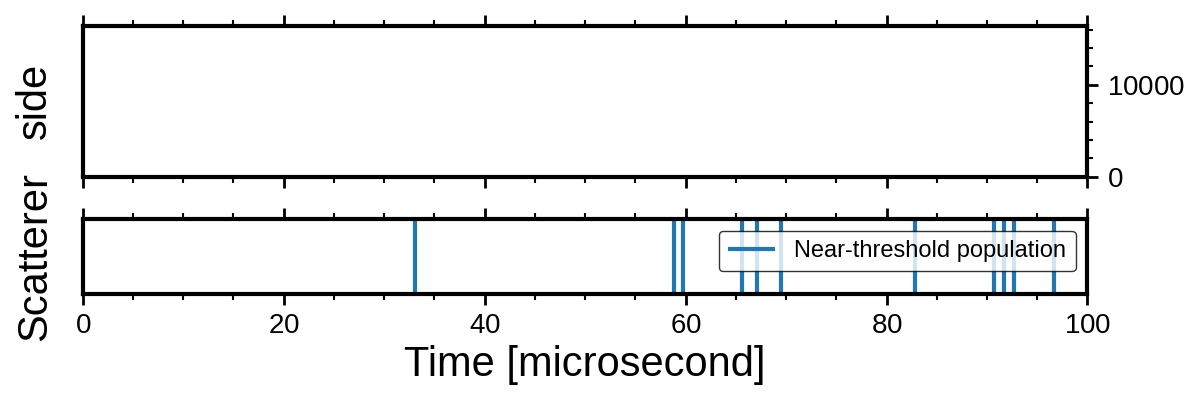
Triggered segments at 5sigma#
Inspect the first 0.1 milliseconds of triggered signal segments.
_ = plot_digital_window(run_record, threshold_value)
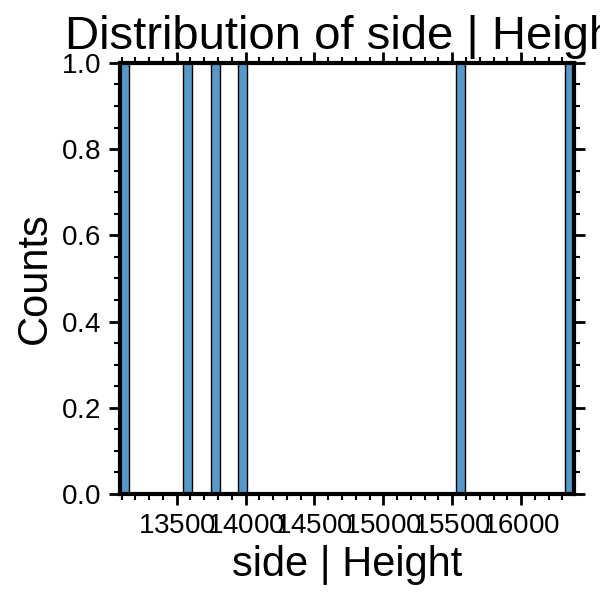
Peak heights at 5sigma#
Compare the recovered weak-event distribution as the threshold rises.
_ = plot_peak_heights(run_record, threshold_value)
Total running time of the script: (0 minutes 6.401 seconds)