
Note
Go to the end to download the full example code.
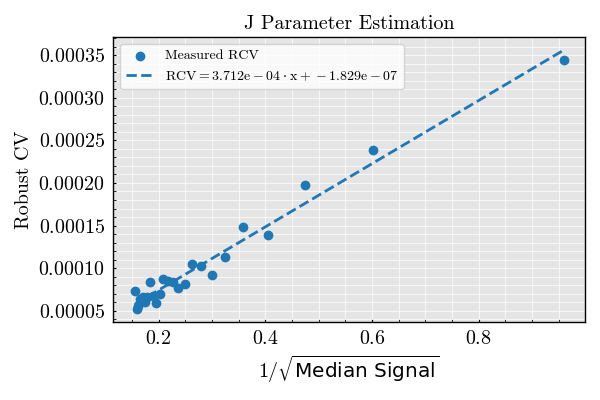
J Estimator Validation — Fixed Bead Size, Variable Illumination#
This example estimates the J parameter, which quantifies how the robust coefficient of variation scales with signal strength under varying illumination power.
The relationship is assumed to follow:
robust_cv ≈ J / sqrt(median_signal)
We simulate a flow cytometry system with fixed bead diameter and vary illumination power across multiple runs.
Setup and configuration#
import matplotlib.pyplot as plt
import numpy as np
from TypedUnit import ureg

from FlowCyPy import FlowCytometer
from FlowCyPy.fluidics import (
    FlowCell,
    Fluidics,
    ScattererCollection,
    SheathFlowRate,
    SampleFlowRate,
)
from FlowCyPy.fluidics.populations import SpherePopulation
from FlowCyPy.opto_electronics import (
    Detector,
    circuits,
    Digitizer,
    OptoElectronics,
    Amplifier,
    source,
)
from FlowCyPy.digital_processing import (
    DigitalProcessing,
    peak_locator,
    discriminator,
)

np.random.seed(3)
Helper functions#
def compute_signal_statistics(data: np.ndarray) -> dict:
    """
    Compute robust and standard statistics from an event signal array.
    """
    if data.size == 0:
        raise ValueError("Signal array is empty.")

    median = np.median(data)
    percentile_84 = np.percentile(data, 84.13)
    percentile_15 = np.percentile(data, 15.87)
    mean = np.mean(data)
    std = np.std(data)
    robust_std = (percentile_84 - percentile_15) / 2.0

    coefficient_of_variation = std / median if median != 0 else np.nan
    robust_coefficient_of_variation = robust_std / median if median != 0 else np.nan

    return {
        "mean": mean,
        "median": median,
        "std": std,
        "cv": coefficient_of_variation,
        "robust_std": robust_std,
        "robust_cv": robust_coefficient_of_variation,
    }


def get_peaks(
    flow_cytometer: FlowCytometer,
    opto_electronics,
    digital_processing,
    run_time=1.5 * ureg.millisecond,
    debug_mode=False,
):
    """
    Run the flow cytometer and return the detected peaks.
    """
    results = flow_cytometer.run(
        opto_electronics=opto_electronics,
        digital_processing=digital_processing,
        run_time=run_time,
    )

    if debug_mode:
        results.plot_analog()
        plt.show()
        results.plot_digital()
        plt.show()

    return results.peaks


def run_experiment(
    flow_cytometer: FlowCytometer,
    opto_electronics,
    digital_processing,
    bead_diameter,
    illumination_power,
    concentration,
    run_time,
    debug_mode=False,
):
    """
    Configure the population and source power, then run one experiment.
    """
    population = SpherePopulation(
        name="population",
        concentration=concentration,
        diameter=bead_diameter,
        medium_refractive_index=1.33,
        refractive_index=1.47,
    )

    flow_cytometer.fluidics.scatterer_collection.populations = [population]
    opto_electronics.source.optical_power = illumination_power

    return get_peaks(
        flow_cytometer=flow_cytometer,
        opto_electronics=opto_electronics,
        digital_processing=digital_processing,
        run_time=run_time,
        debug_mode=debug_mode,
    )


def estimate_j(medians: np.ndarray, robust_cvs: np.ndarray):
    """
    Estimate J from a linear fit of robust_cv versus 1 / sqrt(median).
    """
    if medians.size < 2:
        raise ValueError("At least two measurements are required to estimate J.")

    x = 1.0 / np.sqrt(medians)
    y = robust_cvs

    slope, intercept = np.polyfit(x, y, 1)

    return slope, intercept


def plot_j_estimation(medians: np.ndarray, robust_cvs: np.ndarray):
    """
    Plot robust CV versus 1 / sqrt(median) and its linear fit.
    """
    if medians.size < 2:
        raise ValueError("At least two measurements are required to plot J estimation.")

    x = 1.0 / np.sqrt(medians)
    y = robust_cvs

    slope, intercept = np.polyfit(x, y, 1)
    x_fit = np.linspace(np.min(x), np.max(x), 200)
    y_fit = slope * x_fit + intercept

    figure, axes = plt.subplots(figsize=(6, 4))

    axes.scatter(x, y, label="Robust CV", zorder=3, color='black')
    axes.plot(
        x_fit,
        y_fit,
        "--",
        label=rf"$RCV = {slope:.3e} \cdot x + {intercept:.3e}$",
        zorder=2,
    )
    axes.set(
        xlabel=r"$1 / \sqrt{\mathrm{Median\ Signal}}$",
        ylabel="Robust CV",
        title="J Parameter Estimation",
    )
    axes.legend()

    return figure, slope, intercept
Construct simulation components#
flow_cell = FlowCell(
    sample_volume_flow=SampleFlowRate.MEDIUM.value,
    sheath_volume_flow=SheathFlowRate.MEDIUM.value,
    width=177 * ureg.micrometer,
    height=433 * ureg.micrometer,
    event_scheme="linear",
    perfectly_aligned=True,
)

scatterer_collection = ScattererCollection()

fluidics = Fluidics(
    scatterer_collection=scatterer_collection,
    flow_cell=flow_cell,
)

illumination_source = source.Gaussian(
    waist_z=10 * ureg.micrometer,
    waist_y=60 * ureg.micrometer,
    wavelength=450 * ureg.nanometer,
    optical_power=0 * ureg.watt,
    include_shot_noise=True,
    include_rin_noise=False,
)

digitizer = Digitizer(
    bit_depth=20,
    min_voltage=0 * ureg.volt,
    max_voltage=10_000 * ureg.microvolt,
    sampling_rate=60 * ureg.megahertz,
)

amplifier = Amplifier(
    gain=10 * ureg.volt / ureg.ampere,
    bandwidth=20 * ureg.megahertz,
    voltage_noise_density=0 * ureg.volt / ureg.sqrt_hertz,
    current_noise_density=0 * ureg.ampere / ureg.sqrt_hertz,
)

detector_0 = Detector(
    name="default",
    phi_angle=0 * ureg.degree,
    numerical_aperture=0.2,
    cache_numerical_aperture=0.0,
    responsivity=1 * ureg.ampere / ureg.watt,
    dark_current=0 * ureg.ampere,
)

baseline_restoration = circuits.BaselineRestorationServo(
    time_constant=10 * ureg.microsecond
)

opto_electronics = OptoElectronics(
    detectors=[detector_0],
    digitizer=digitizer,
    analog_processing=[baseline_restoration],
    source=illumination_source,
    amplifier=amplifier,
)

peak_algorithm = peak_locator.GlobalPeakLocator()

dynamic_window_discriminator = discriminator.DynamicWindow(
    trigger_channel="default",
    threshold=100
    * ureg.microvolt,  # Absolute threshold to ensure detection at low illumination
    pre_buffer=200,
    post_buffer=200,
)


digital_processing = DigitalProcessing(
    peak_algorithm=peak_algorithm,
    discriminator=dynamic_window_discriminator,
)

flow_cytometer = FlowCytometer(
    fluidics=fluidics,
    background_power=illumination_source.optical_power * 0.00,
)
Run J estimation simulation#
debug_mode = False
run_time = 10 * ureg.millisecond
bead_diameter = 1000 * ureg.nanometer
concentration = 2.5e7 * ureg.particle / ureg.milliliter / 1
illumination_powers = np.linspace(10, 380, 25) * ureg.milliwatt

medians = []
robust_stds = []
robust_cvs = []
valid_illumination_powers = []

for index, illumination_power in enumerate(illumination_powers):
    print(
        f"[INFO] Running simulation {index + 1}/{len(illumination_powers)} "
        f"at {illumination_power}"
    )

    peaks = run_experiment(
        flow_cytometer=flow_cytometer,
        opto_electronics=opto_electronics,
        digital_processing=digital_processing,
        bead_diameter=bead_diameter,
        illumination_power=illumination_power,
        concentration=concentration,
        run_time=run_time,
        debug_mode=debug_mode,
    )

    if "Height" not in peaks:
        raise KeyError("The peaks dataframe does not contain a 'Height' column.")

    signal_array = peaks["Height"].values.astype(float)

    if signal_array.size < 3:
        print(
            f"[WARNING] Skipping {illumination_power} because only "
            f"{signal_array.size} peak(s) were detected."
        )
        continue

    statistics = compute_signal_statistics(signal_array)

    medians.append(statistics["median"])
    robust_stds.append(statistics["robust_std"])
    robust_cvs.append(statistics["robust_cv"])
    valid_illumination_powers.append(illumination_power)

    if debug_mode:
        print(f"[DEBUG] Median: {statistics['median']:.3e}")
        print(f"[DEBUG] Robust STD: {statistics['robust_std']:.3e}")
        print(f"[DEBUG] Robust CV: {statistics['robust_cv']:.5f}")


medians = np.asarray(medians, dtype=float)
robust_stds = np.asarray(robust_stds, dtype=float)
robust_cvs = np.asarray(robust_cvs, dtype=float)

if medians.size < 2:
    raise ValueError("Not enough valid measurements were collected to estimate J.")
[INFO] Running simulation 1/25 at 10.0 milliwatt
[INFO] Running simulation 2/25 at 25.416666666666664 milliwatt
[INFO] Running simulation 3/25 at 40.83333333333333 milliwatt
[INFO] Running simulation 4/25 at 56.25 milliwatt
[INFO] Running simulation 5/25 at 71.66666666666666 milliwatt
[INFO] Running simulation 6/25 at 87.08333333333333 milliwatt
[INFO] Running simulation 7/25 at 102.5 milliwatt
[INFO] Running simulation 8/25 at 117.91666666666666 milliwatt
[INFO] Running simulation 9/25 at 133.33333333333331 milliwatt
[INFO] Running simulation 10/25 at 148.75 milliwatt
[INFO] Running simulation 11/25 at 164.16666666666666 milliwatt
[INFO] Running simulation 12/25 at 179.58333333333331 milliwatt
[INFO] Running simulation 13/25 at 195.0 milliwatt
[INFO] Running simulation 14/25 at 210.41666666666666 milliwatt
[INFO] Running simulation 15/25 at 225.83333333333331 milliwatt
[INFO] Running simulation 16/25 at 241.25 milliwatt
[INFO] Running simulation 17/25 at 256.66666666666663 milliwatt
[INFO] Running simulation 18/25 at 272.0833333333333 milliwatt
[INFO] Running simulation 19/25 at 287.5 milliwatt
[INFO] Running simulation 20/25 at 302.91666666666663 milliwatt
[INFO] Running simulation 21/25 at 318.3333333333333 milliwatt
[INFO] Running simulation 22/25 at 333.75 milliwatt
[INFO] Running simulation 23/25 at 349.16666666666663 milliwatt
[INFO] Running simulation 24/25 at 364.5833333333333 milliwatt
[INFO] Running simulation 25/25 at 380.0 milliwatt
Estimate J#
j_slope, j_intercept = estimate_j(
    medians=medians,
    robust_cvs=robust_cvs,
)

j_estimate = j_slope * ureg.AU**0.5

print("")
print("J estimation results")
print(f"Estimated J: {j_estimate}")
print(f"Linear intercept: {j_intercept:.6e}")
J estimation results
Estimated J: 0.11637911516282591 dimensionless
Linear intercept: 4.661837e-05
Plot estimation and diagnostics#
from MPSPlots.styles import scientific

with plt.style.context(scientific):
    figure_j, _, _ = plot_j_estimation(
        medians=medians,
        robust_cvs=robust_cvs,
    )


plt.show()
Total running time of the script: (1 minutes 35.308 seconds)