
Note
Go to the end to download the full example code.
Convergence of the Percus–Yevick reference#
Before comparing an RSA estimate to an analytical reference, verify that the
numerical inverse transform used by the Percus–Yevick calculation is resolved.
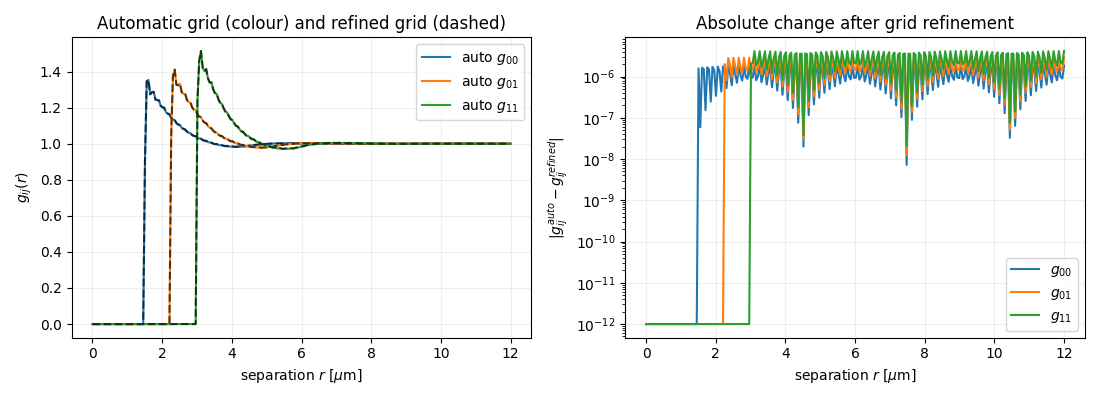
This example compares the beginner-friendly wavenumber="auto" grid with a
twice-refined grid on the same hard-sphere mixture.
This is a numerical convergence check for Percus–Yevick, not a claim that RSA converges to Percus–Yevick. RSA and Percus–Yevick remain distinct models.
import matplotlib.pyplot as plt
import numpy as np

from PackLab import analytical, ureg
Define one mixture and a real-space support#
radii = np.array([0.75, 1.5]) * ureg.micrometer
number_fractions = np.array([0.5, 0.5])
volume_fraction = 0.15
domain = analytical.PercusYevickDomain(
    size=100_000 * ureg.micrometer,
    radii=radii,
    volume_fraction=volume_fraction,
    number_fractions=number_fractions,
)
distances = np.linspace(0.0, 12.0, 240) * ureg.micrometer

automatic = analytical.PercusYevickSolver(
    densities=domain.particle_densities_per_radius,
    radii=domain.radii,
    wavenumber="auto",
).compute(distances)

refined_grid = analytical.make_wavenumber_grid(
    radial_resolution=domain.radii.min() / 20,
    maximum_distance=distances.max(),
    samples_per_oscillation=24,
)
refined = analytical.PercusYevickSolver(
    densities=domain.particle_densities_per_radius,
    radii=domain.radii,
    wavenumber=refined_grid,
).compute(distances)

print(f"Automatic grid: {len(automatic.wavenumber)} wavenumber points")
print(f"Refined grid:   {len(refined.wavenumber)} wavenumber points")
Automatic grid: 1922 wavenumber points
Refined grid:   3842 wavenumber points
Plot the reference and its refinement error#
Agreement away from hard-core discontinuities indicates that the default grid
is sufficiently resolved for this radial range. If it is not, decrease
radial_resolution or increase samples_per_oscillation.
figure, (curves_axis, error_axis) = plt.subplots(1, 2, figsize=(11, 4))

for i, j in ((0, 0), (0, 1), (1, 1)):
    label = rf"$g_{{{i}{j}}}$"
    _ = curves_axis.plot(distances, automatic.g[i, j], label=f"auto {label}")
    _ = curves_axis.plot(distances, refined.g[i, j], "--", color="black", alpha=0.65)
    _ = error_axis.semilogy(
        distances,
        np.maximum(np.abs(automatic.g[i, j] - refined.g[i, j]), 1e-12),
        label=label,
    )

curves_axis.set_title("Automatic grid (colour) and refined grid (dashed)")
curves_axis.set_xlabel("separation $r$ [$\\mu$m]")
curves_axis.set_ylabel(r"$g_{ij}(r)$")
_ = curves_axis.legend()
curves_axis.grid(alpha=0.2)

error_axis.set_title("Absolute change after grid refinement")
error_axis.set_xlabel("separation $r$ [$\\mu$m]")
error_axis.set_ylabel(r"$|g_{ij}^{auto} - g_{ij}^{refined}|$")
_ = error_axis.legend()
error_axis.grid(alpha=0.2)
figure.tight_layout()
Total running time of the script: (0 minutes 0.602 seconds)