

Note
Go to the end to download the full example code.
Infinite-medium diffusion#
All physical values are illustrative. The plotted box is an observation window, not a tissue boundary. Optical properties apply at 970 nm.
import os
import matplotlib.pyplot as plt
import numpy as np
import MomentRT
from MomentRT import (
    CartesianMesh,
    HomogeneousMedium,
    InfiniteP1,
    Material,
    PointSource,
    Simulation,
    ureg,
)

show_figures = os.environ.get("MOMENTRT_SPHINX_GALLERY") != "1"
Optical properties#
Define illustrative absorption and reduced scattering at 970 nm.
material = Material(
    phase_function=MomentRT.phase_function.HenyeyGreenstein(),
    absorption=0.02 / ureg.millimeter,
    reduced_scattering=1 / ureg.millimeter,
    refractive_index=1.4,
)

medium = HomogeneousMedium(
    material=material,
)
Observation window#
This grid samples an infinite medium; its edges are not physical boundaries. The even node counts avoid sampling the singular point source.
mesh = CartesianMesh(
    shape=(50, 50, 50),
    spacing=np.array([0.4, 0.4, 0.4]) * ureg.millimeter,
    origin=(-9.8, -9.8, -9.8) * ureg.millimeter,
)
Embedded illumination#
Place an isotropic point source at the center of the observation window.
source = PointSource(
    position=np.zeros(3) * ureg.millimeter,
    wavelength=970 * ureg.nanometer,
    optical_power=1 * ureg.milliwatt,
)
Configure transport#
Keep the numerical model separate from the physical configuration.
solver = InfiniteP1()
Compose the experiment#
Combine the medium, illumination, observation mesh, and solver.
simulation = Simulation(
    medium=medium,
    source=source,
    mesh=mesh,
    solver=solver,
)
Inspect the configuration#
Rotate the three-dimensional observation window and locate the source.
geometry = simulation.plot_system(
    show=show_figures,
)
Calculate fluence#
Solve the analytical infinite-medium diffusion model.
result = simulation.run()
Inspect the fluence field#
The volume uses a logarithmic color scale with physical values retained on hover. Values close to the source remain diffusion approximations.
figure = result.fluence.plot(
    view="volume",
    scale="log",
    show=show_figures,
)
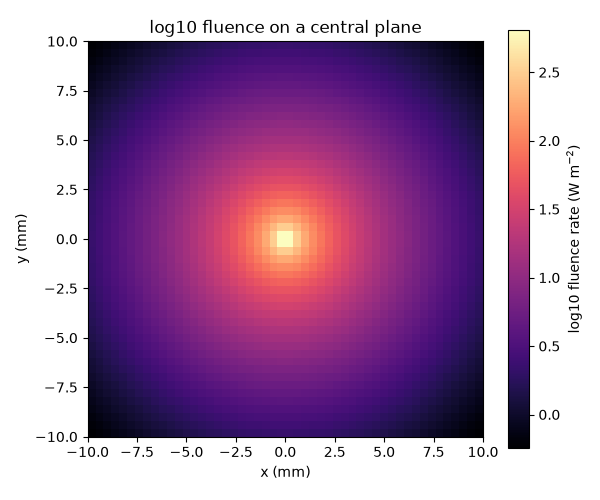
Make a static central-plane overview#
The gallery uses this Matplotlib image as a compact thumbnail. The live three-dimensional Plotly volume remains available in the example above.
fluence_values = result.fluence.values.to("watt / meter**2").magnitude

plane_index = mesh.shape[2] // 2

x_axis = (
    (mesh.origin[0] + np.arange(mesh.shape[0]) * mesh.spacing[0])
    .to("millimeter")
    .magnitude
)

y_axis = (
    (mesh.origin[1] + np.arange(mesh.shape[1]) * mesh.spacing[1])
    .to("millimeter")
    .magnitude
)

figure_static, axes = plt.subplots(figsize=(6, 5))

image = axes.pcolormesh(
    x_axis,
    y_axis,
    np.log10(fluence_values[:, :, plane_index].T),
    shading="auto",
    cmap="magma",
)

axes.set_aspect("equal")
axes.set_xlabel("x (mm)")
axes.set_ylabel("y (mm)")
axes.set_title("log10 fluence on a central plane")
figure_static.colorbar(image, ax=axes, label="log10 fluence rate (W m$^{-2}$)")
figure_static.tight_layout()

if show_figures:
    plt.show()
Inspect the modeled geometry#
This view shows the configured geometry and instrument footprints.
gallery_system_figure = simulation.plot_system(show=False)
Total running time of the script: (0 minutes 1.638 seconds)