

Note
Go to the end to download the full example code.
Surface illumination and FEM diffusion#
Illustrative single-wavelength properties. Effective reflectance is supplied explicitly, not inferred from refractive index. All internal refractive indices are equal: refracting internal interfaces are outside this solver’s scope.
import matplotlib.pyplot as plt
import numpy as np
import MomentRT
from MomentRT import (
    P1,
    Material,
    RobinBoundary,
    Simulation,
    StructuredMedium,
    SurfaceSource,
    TetrahedralMesh,
    ureg,
)
Single-wavelength materials#
Use equal internal refractive indices: this continuous-fluence FEM model does not support refracting internal interfaces.
background = Material(
    phase_function=MomentRT.phase_function.HenyeyGreenstein(),
    absorption=0.02 / ureg.millimeter,
    reduced_scattering=1 / ureg.millimeter,
    refractive_index=1.4,
)

upper_material = Material(
    phase_function=MomentRT.phase_function.HenyeyGreenstein(),
    absorption=0.04 / ureg.millimeter,
    reduced_scattering=1.5 / ureg.millimeter,
    refractive_index=1.4,
)
Build the layered sample#
Create a finite rectangular sample and add a one-millimeter upper layer.
sample = StructuredMedium(
    origin=(-4, -4, 0) * ureg.millimeter,
    size=(8, 8, 4) * ureg.millimeter,
)

sample.add_background(
    material=background,
)

sample.add_layer(
    name="Upper layer",
    thickness=1 * ureg.millimeter,
    material=upper_material,
)
Discretize the sample#
Generate tetrahedra fitted to the layer interface. Resolution is a target element size; refine the mesh to assess spatial and source-footprint accuracy.
mesh = TetrahedralMesh.from_sample(
    sample=sample,
    resolution=0.5 * ureg.millimeter,
)
Illuminate the surface#
Define a finite circular diffuse spot on the upper face. Optical power is already coupled into the sample, excluding specular entry losses.
source = SurfaceSource(
    face="z_min",
    position=np.array([0, 0, 0]) * ureg.millimeter,
    radius=1 * ureg.millimeter,
    wavelength=970 * ureg.nanometer,
    optical_power=1 * ureg.milliwatt,
)
Configure boundary conditions#
Supply the effective diffuse reflectance explicitly on every face. It is not the normal-incidence Fresnel reflectance.
boundary = RobinBoundary(
    effective_reflectance=0.5,
)

solver = P1(
    boundaries=MomentRT.Boundaries.uniform(condition=boundary),
)
Compose the simulation#
Keep sample, mesh, illumination, and solver configuration distinct.
simulation = Simulation(
    medium=sample,
    source=source,
    mesh=mesh,
    solver=solver,
)
Inspect the illuminated sample#
The red circle shows the illumination footprint on the sample surface.
geometry = simulation.plot_system(
    show=False,
)
Solve and check energy balance#
Compare incoming, absorbed, and escaping power. Conservation verifies numerical accounting, not the accuracy of diffusion against radiative transfer.
result = simulation.run()

print(f"Incoming power: {result.energy_balance['incoming_power']}")

print(f"Absorbed power: {result.energy_balance['absorbed_power'].to('milliwatt')}")

print(f"Escaping power: {result.energy_balance['escaping_power'].to('milliwatt')}")

print(f"Energy residual: {result.energy_balance['residual_power'].to('watt')}")
Incoming power: 1 milliwatt
Absorbed power: 0.24344504993650523 milliwatt
Escaping power: 0.7565549500634947 milliwatt
Energy residual: 1.0842021724855044e-19 watt
Explore fluence in 3D#
Inspect the fluence volume. The logarithmic colors retain physical hover values; neither negative values nor zeros are silently clipped.
figure = result.fluence.plot(
    view="volume",
    scale="log",
    display_resolution=0.4 * ureg.millimeter,
    show=False,
)
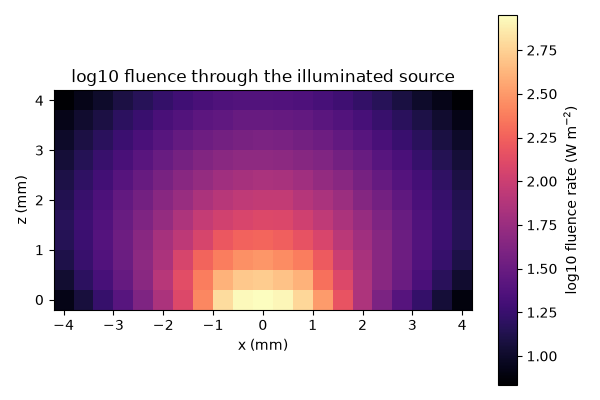
Save a representative cross-section#
This static plane complements the interactive volume above; use the Plotly view to rotate the sample and inspect physical hover values.
display_field = result.fluence.resample(resolution=0.4 * ureg.millimeter)

display_mesh = display_field.mesh

fluence_values = display_field.values.to("watt / meter**2").magnitude

center_y = display_mesh.shape[1] // 2

x_axis = (
    (
        display_mesh.origin[0]
        + np.arange(display_mesh.shape[0]) * display_mesh.spacing[0]
    )
    .to("millimeter")
    .magnitude
)

z_axis = (
    (
        display_mesh.origin[2]
        + np.arange(display_mesh.shape[2]) * display_mesh.spacing[2]
    )
    .to("millimeter")
    .magnitude
)

figure_static, axes = plt.subplots(figsize=(6, 4))

image = axes.pcolormesh(
    x_axis,
    z_axis,
    np.log10(fluence_values[:, center_y, :].T),
    shading="auto",
    cmap="magma",
)

axes.set_aspect("equal")
axes.set_xlabel("x (mm)")
axes.set_ylabel("z (mm)")
axes.set_title("log10 fluence through the illuminated source")
figure_static.colorbar(image, ax=axes, label="log10 fluence rate (W m$^{-2}$)")
figure_static.tight_layout()
Inspect diffusive flux#
Arrows show element-centered flux without smoothing across interfaces.
flux_figure = result.flux.plot(
    show=False,
)
Inspect the modeled geometry#
This view shows the configured geometry and instrument footprints.
gallery_system_figure = simulation.plot_system(show=False)
Total running time of the script: (0 minutes 1.279 seconds)