

Note
Go to the end to download the full example code.
Which skin layer changes the fiber signal?#
Add the SAME absorption increment to epidermis, dermis, or hypodermis, one layer at a time, and compare a two-fiber distance scan with the unmodified sample. This tests whether a signal change depends on where the extra absorption occurs, rather than only its magnitude. It is a forward sensitivity experiment, not a method for identifying an unknown absorber uniquely.
Baseline properties are MomentRT’s illustrative 850 nm Shimojo preset from one ex vivo skin dataset. The added absorption is hypothetical. P1 and Lambertian collection are model approximations, not validated skin-probe predictions.
References#
Shimojo, Y. et al. (2020), Journal of Biomedical Optics, 25(4), 045002. https://doi.org/10.1117/1.JBO.25.4.045002
import copy
import matplotlib.pyplot as plt
import numpy as np
import MomentRT
from MomentRT.models.skin import ShimojoThreeLayer850nm

ureg = MomentRT.ureg
Configure one source and a scanning collection fiber#
The surface is z = 0 and positive z points into the sample. The preset uses 0.2 mm epidermis, 1.5 mm dermis, and hypodermis below. Source power is diffuse power already coupled into tissue. All layers share refractive index 1.4, with explicitly matched-index, zero-reflectance Robin conditions on all faces. Collection circles are alternative positions of ONE passive fiber, not a physical array. Each uses a 30 degree acceptance half-angle and a Lambertian angular model; fiber propagation, entry losses, and specular return are omitted.
baseline_sample = ShimojoThreeLayer850nm(
    origin=(-5, -4, 0) * ureg.mm,
    size=(12, 8, 6) * ureg.mm,
)

source = MomentRT.SurfaceSource.on_face(
    sample=baseline_sample,
    face="z_min",
    coordinates=(-2, 0) * ureg.mm,
    radius=0.3 * ureg.mm,
    wavelength=850 * ureg.nm,
    optical_power=1 * ureg.mW,
    name="Illumination fiber",
)

separations = np.linspace(0.8, 4.0, 9) * ureg.mm

detectors = {
    f"position_{index}": MomentRT.SurfaceDetector.on_face(
        sample=baseline_sample,
        face="z_min",
        coordinates=np.array([-2 + separation.to("mm").magnitude, 0]) * ureg.mm,
        radius=0.3 * ureg.mm,
        orientation="outward_normal",
        acceptance_angle=30 * ureg.degree,
        name=f"Collection at {separation.to('mm').magnitude:.1f} mm",
    )
    for index, separation in enumerate(separations)
}

solver = MomentRT.P1(
    boundaries=MomentRT.Boundaries.uniform(
        condition=MomentRT.RobinBoundary(effective_reflectance=0),
    ),
)

mesh_resolutions_mm = (0.55, 0.4)

contact_resolutions_mm = (0.12, 0.08)
Perturb one entire anatomical layer at a time#
An absolute increment of 0.10 mm^-1 makes the perturbations comparable in coefficient units. A fixed multiplier would apply different increments to the three baseline coefficients. The layer volumes are different, so equal increments are NOT equal added absorbed power. Keep geometry, scattering, phase functions, source, apertures, and boundaries fixed in every comparison. Hypodermis includes both its named region and the background below that region.
absorption_increment = 0.10 / ureg.mm

case_names = (
    "Baseline",
    "Epidermis + absorption",
    "Dermis + absorption",
    "Hypodermis + absorption",
)

layer_names = (None, "Epidermis", "Dermis", "Hypodermis (subcutaneous fat)")

collected_power_uw = np.empty(
    (len(mesh_resolutions_mm), len(case_names), len(detectors))
)

area_errors = np.empty((len(mesh_resolutions_mm), len(case_names)))

for level, (bulk_resolution, contact_resolution) in enumerate(
    zip(mesh_resolutions_mm, contact_resolutions_mm)
):
    sample = baseline_sample

    mesh = MomentRT.TetrahedralMesh.from_sample(
        sample=sample,
        resolution=bulk_resolution * ureg.mm,
    )

    mesh.refine_region(
        name="Epidermis",
        resolution=contact_resolution * ureg.mm,
    )

    mesh.refine_near(
        objects=[source, *detectors.values()],
        resolution=contact_resolution * ureg.mm,
        distance=0.3 * ureg.mm,
    )

    for case, layer_name in enumerate(layer_names):
        sample = copy.deepcopy(baseline_sample)

        if layer_name is not None:
            layer = next(
                region for region in sample.structures if region.name == layer_name
            )

            material = layer.material

            layer.material = MomentRT.Material(
                absorption=material.absorption + absorption_increment,
                reduced_scattering=material.reduced_scattering,
                refractive_index=material.refractive_index,
                anisotropy=material.anisotropy,
                phase_function=material.phase_function,
            )

            if layer_name == "Hypodermis (subcutaneous fat)":
                sample.add_background(material=layer.material)

        simulation = MomentRT.Simulation(
            medium=sample,
            source=source,
            mesh=mesh,
            solver=solver,
            detectors=detectors,
        )

        result = simulation.run()

        collected_power_uw[level, case] = [
            result.detector_power[name].to("uW").magnitude for name in detectors
        ]

        area_ratios = [
            (result.source_sampled_area / result.source_geometric_area)
            .to("")
            .magnitude,
            *[
                (measurement.sampled_area / measurement.geometric_area).to("").magnitude
                for measurement in result.detectors.values()
            ],
        ]

        area_errors[level, case] = np.max(np.abs(np.asarray(area_ratios) - 1))

        residual_fraction = (
            (result.energy_balance["residual_power"] / source.optical_power)
            .to("")
            .magnitude
        )

        print(
            f"Mesh {level + 1}, {case_names[case]}: "
            f"{len(mesh.tetrahedra)} tetrahedra, "
            f"maximum source/aperture area error = {area_errors[level, case]:.2%}, "
            f"energy residual / input = {residual_fraction:.2e}, "
            f"minimum fluence = {result.fluence.values.min().to('W/m^2'):~P}"
        )
Mesh 1, Baseline: 106032 tetrahedra, maximum source/aperture area error = 2.55%, energy residual / input = 5.42e-16, minimum fluence = 0.00016694191035981557 W/m²
Mesh 1, Epidermis + absorption: 106032 tetrahedra, maximum source/aperture area error = 2.55%, energy residual / input = -6.51e-16, minimum fluence = 0.00014146978518641109 W/m²
Mesh 1, Dermis + absorption: 106032 tetrahedra, maximum source/aperture area error = 2.55%, energy residual / input = 8.67e-16, minimum fluence = 3.789834992244184×10⁻⁵ W/m²
Mesh 1, Hypodermis + absorption: 106032 tetrahedra, maximum source/aperture area error = 2.55%, energy residual / input = 1.84e-15, minimum fluence = 4.7298512900972704×10⁻⁵ W/m²
Mesh 2, Baseline: 314343 tetrahedra, maximum source/aperture area error = 1.14%, energy residual / input = 6.51e-16, minimum fluence = 0.0002500335174666656 W/m²
Mesh 2, Epidermis + absorption: 314343 tetrahedra, maximum source/aperture area error = 1.14%, energy residual / input = 2.17e-15, minimum fluence = 0.0002190969039579888 W/m²
Mesh 2, Dermis + absorption: 314343 tetrahedra, maximum source/aperture area error = 1.14%, energy residual / input = 1.63e-15, minimum fluence = 6.141462303361963×10⁻⁵ W/m²
Mesh 2, Hypodermis + absorption: 314343 tetrahedra, maximum source/aperture area error = 1.14%, energy residual / input = 1.73e-15, minimum fluence = 6.927423313854669×10⁻⁵ W/m²
Report spatial sensitivity without hiding unresolved values#
These two meshes measure sensitivity to one refinement, not a converged sequence. Disk area checks do not establish field accuracy. Minimum fluence and energy residuals above retain numerical artifacts. Never clip negative powers before plotting or infer transport accuracy from energy conservation. Quantitative probe design also needs larger-domain checks and comparison with a radiative-transfer or Monte Carlo reference, especially near the source.
if not np.all(np.isfinite(collected_power_uw)) or np.any(collected_power_uw <= 0):
    raise ValueError("Unresolved or nonpositive detector powers; refine the study.")

relative_change = (
    np.abs(collected_power_uw[-1] - collected_power_uw[-2]) / collected_power_uw[-1]
)

print(f"Maximum collected-power change on refinement: {np.max(relative_change):.2%}")

for case, name in enumerate(case_names):
    print(
        f"{name}: finest-mesh power at 0.8 / 4 mm = "
        f"{collected_power_uw[-1, case, 0]:.4g} / "
        f"{collected_power_uw[-1, case, -1]:.4g} uW"
    )
Maximum collected-power change on refinement: 3.19%
Baseline: finest-mesh power at 0.8 / 4 mm = 4.714 / 0.02392 uW
Epidermis + absorption: finest-mesh power at 0.8 / 4 mm = 4.373 / 0.02153 uW
Dermis + absorption: finest-mesh power at 0.8 / 4 mm = 4.363 / 0.009122 uW
Hypodermis + absorption: finest-mesh power at 0.8 / 4 mm = 4.696 / 0.01796 uW
Compare absolute signal and layer-specific contrast#
Solid curves use the finer mesh and dotted curves use the coarser mesh on BOTH panels. Suppression is measured relative to the baseline at each mesh level. It is not normalized by the nearest collection position, which would discard part of the absorption effect. Overlapping responses show why a distance scan alone does not establish a unique depth or absorption profile.
figure, axes = plt.subplots(
    1,
    2,
    figsize=(12, 4.5),
)

for case, name in enumerate(case_names):
    for level, linestyle in enumerate((":", "-")):
        axes[0].semilogy(
            separations.to("mm").magnitude,
            collected_power_uw[level, case],
            linestyle=linestyle,
            marker="o" if level else None,
            color=f"C{case}",
            label=name if level else None,
        )

        if case:
            suppression = 100 * (
                1 - collected_power_uw[level, case] / collected_power_uw[level, 0]
            )

            axes[1].plot(
                separations.to("mm").magnitude,
                suppression,
                linestyle=linestyle,
                marker="o" if level else None,
                color=f"C{case}",
                label=name if level else None,
            )

    if case:
        print(
            f"{name}: signal suppression at 0.8 / 4 mm = "
            f"{100 * (1 - collected_power_uw[-1, case, 0] / collected_power_uw[-1, 0, 0]):.2f}% / "
            f"{100 * (1 - collected_power_uw[-1, case, -1] / collected_power_uw[-1, 0, -1]):.2f}%"
        )

axes[0].set_title("Same absorption increment, different layer")
axes[0].set_ylabel("Collected power (µW), 1 mW coupled input")
axes[1].set_title("Absorption contrast by layer")
axes[1].set_ylabel("Signal suppression relative to baseline (%)")

for axis in axes:
    axis.set_xlabel("Fiber center-to-center separation (mm)")
    axis.grid(
        True,
        which="both",
        alpha=0.25,
    )
    axis.legend()

figure.tight_layout()
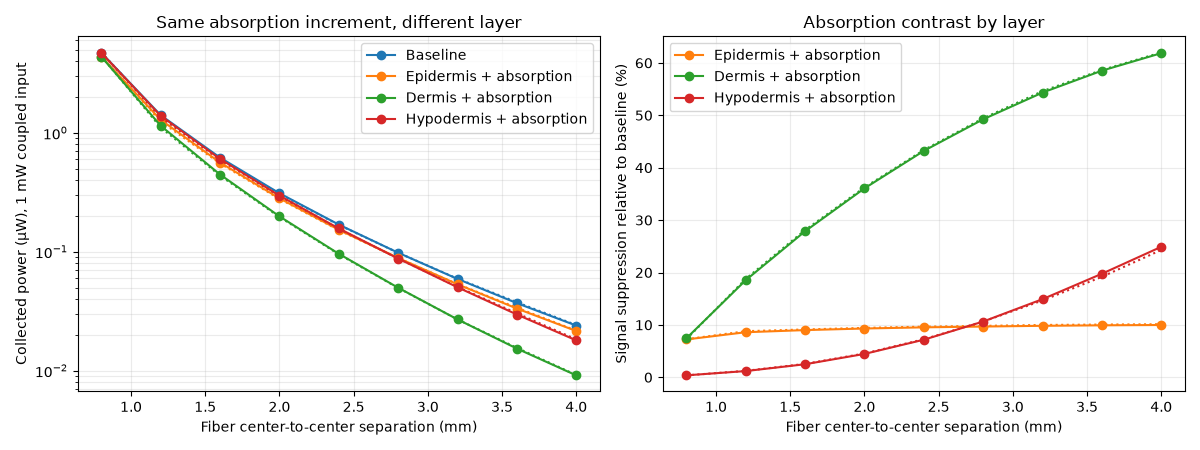
Epidermis + absorption: signal suppression at 0.8 / 4 mm = 7.23% / 9.98%
Dermis + absorption: signal suppression at 0.8 / 4 mm = 7.43% / 61.86%
Hypodermis + absorption: signal suppression at 0.8 / 4 mm = 0.38% / 24.91%
Inspect the final case in three dimensions#
Rings show alternative scan positions. Linear color preserves the sign of the interpolated field; sampled layer surfaces are construction overlays.
gallery_system_figure = result.fluence.plot(
    view="volume",
    scale="linear",
    display_resolution=0.3 * ureg.mm,
    overlays=[source, *detectors.values(), *sample.structures],
    show=False,
)
Total running time of the script: (1 minutes 5.665 seconds)