
Note
Go to the end to download the full example code.
Metropolis sampling cost per sweep#
Measure the cost of advancing the same initial periodic configuration for several sweep counts. Each measurement starts a new sampler with the same seed; the reported median of three runs includes sampler construction. These short timings measure work, not equilibration or statistical accuracy. Report hardware, package version, and thread settings with results.
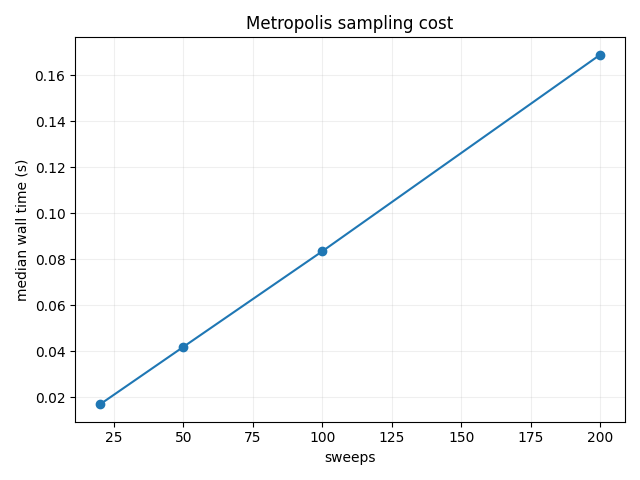
20 sweeps, 191 spheres: median 0.0169 s
50 sweeps, 191 spheres: median 0.0419 s
100 sweeps, 191 spheres: median 0.0835 s
200 sweeps, 191 spheres: median 0.1690 s
from time import perf_counter
import matplotlib.pyplot as plt
import numpy as np
from PackLab import monte_carlo, samplers, ureg

domain = monte_carlo.PackingDomain(
    3 * ureg.micrometer, 3 * ureg.micrometer, 3 * ureg.micrometer, use_periodic_boundaries=True
)
rsa = monte_carlo.RSAOptions()
rsa.random_seed = 42
rsa.target_packing_fraction = 0.1
rsa.maximum_attempts = 100000
initial = monte_carlo.RSASimulator(
    domain, samplers.ConstantRadiusSampler(0.15 * ureg.micrometer), rsa
).run()
counts = [20, 50, 100, 200]
timings = []
for sweeps in counts:
    runs = []
    for _ in range(3):
        options = monte_carlo.MetropolisOptions()
        options.random_seed = 43
        options.number_of_sweeps = sweeps
        options.maximum_displacement = 0.05 * ureg.micrometer
        start = perf_counter()
        simulator = monte_carlo.MetropolisSimulator(domain, initial.sphere_configuration, options)
        simulator.run()
        runs.append(perf_counter() - start)
    timings.append(np.median(runs))
    print(f"{sweeps} sweeps, {initial.statistics.sphere_count} spheres: median {timings[-1]:.4f} s")
figure, axis = plt.subplots()
axis.plot(counts, timings, "o-")
axis.set(xlabel="sweeps", ylabel="median wall time (s)", title="Metropolis sampling cost")
axis.grid(alpha=0.2)
figure.tight_layout()
Total running time of the script: (0 minutes 0.999 seconds)