
Note
Go to the end to download the full example code.
Effect of optical contrast#
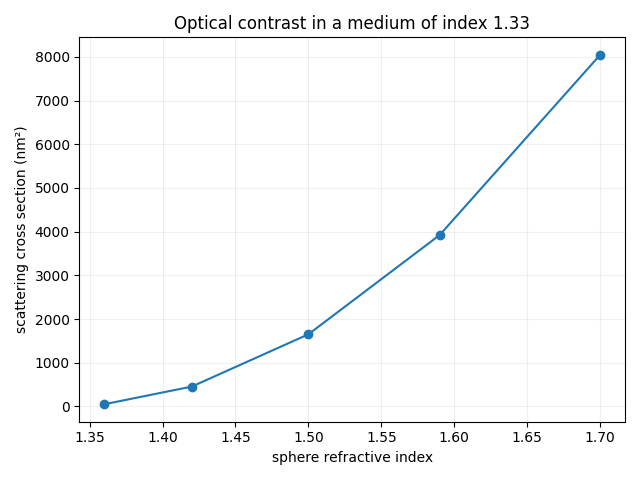
Change the sphere refractive index at fixed diameter, wavelength, and medium. The resulting cross sections describe isolated spheres, without structural correlations between particles.
import matplotlib.pyplot as plt
import numpy as np
from PackLab import scattering, ureg

indices = [1.36, 1.42, 1.50, 1.59, 1.70]
cross_sections = []
for index in indices:
    dataset = scattering.compute_scattering_amplitudes(
        wavelength=532 * ureg.nanometer,
        diameters=np.array([200]) * ureg.nanometer,
        material=index,
        medium=1.33,
        phi=np.linspace(-90, 90, 181) * ureg.degree,
    )
    dataset.process()
    cross_sections.append(dataset.Csca.to("nanometer**2").magnitude[0])
figure, axis = plt.subplots()
axis.plot(indices, cross_sections, "o-")
axis.set(
    xlabel="sphere refractive index",
    ylabel="scattering cross section (nm²)",
    title="Optical contrast in a medium of index 1.33",
)
axis.grid(alpha=0.2)
figure.tight_layout()
Total running time of the script: (0 minutes 0.068 seconds)