
Note
Go to the end to download the full example code.
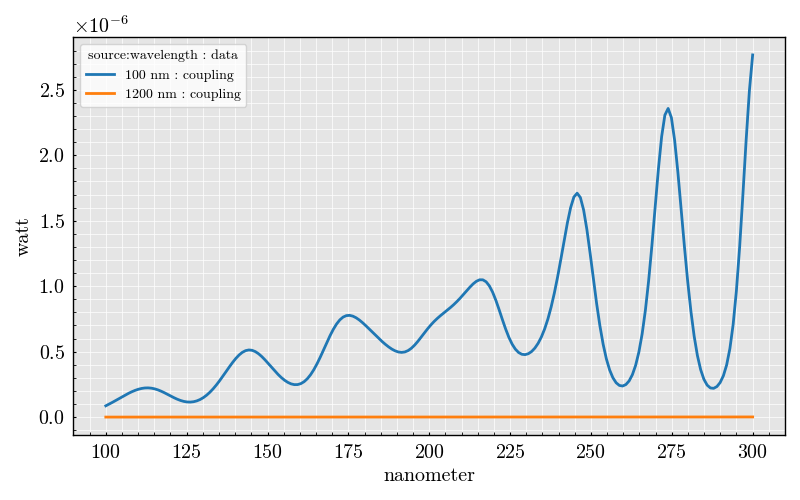
InfiniteCylinder: Coupling vs Diameter#
This example demonstrates how to compute and visualize the coupling efficiency as a function of diameter for cylindrical scatterers using PyMieSim.
<Figure size 1000x600 with 1 Axes>
import numpy as np
from PyMieSim.units import ureg

from PyMieSim.experiment.detector_set import PhotodiodeSet
from PyMieSim.experiment.scatterer_set import InfiniteCylinderSet
from PyMieSim.experiment.source_set import GaussianSet
from PyMieSim.experiment.polarization_set import PolarizationSet
from PyMieSim.experiment import Setup

polarization_set = PolarizationSet(
    angles=[90.0] * ureg.degree,
)

source = GaussianSet(
    wavelength=[100, 1200] * ureg.nanometer,
    polarization=polarization_set,
    optical_power=[1e-3] * ureg.watt,
    numerical_aperture=[0.2],
)

scatterer = InfiniteCylinderSet(
    diameter=np.linspace(100, 300, 200) * ureg.nanometer,
    material=[1.4],
    medium=[1.0],
)

detector = PhotodiodeSet(
    numerical_aperture=[0.1],
    phi_offset=[-180.0] * ureg.degree,
    gamma_offset=[0.0] * ureg.degree,
    sampling=[600],
    polarization_filter=None,
)

experiment = Setup(scatterer_set=scatterer, source_set=source, detector_set=detector)

dataframe = experiment.get("coupling")

dataframe.plot(x="scatterer:diameter")
Total running time of the script: (0 minutes 0.315 seconds)