
Note
Go to the end to download the full example code.
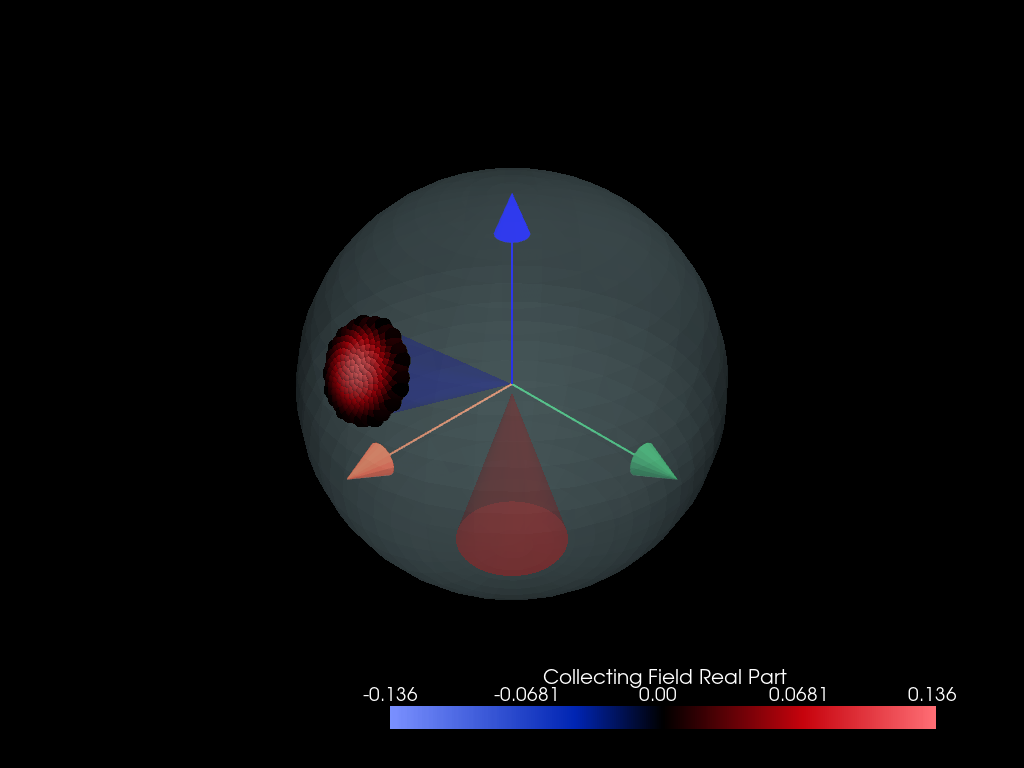
Plot system#
Example Script: Using the plot_system Function
This script demonstrates how to use the plot_system function to create a 3D visualization of a system consisting of a light source, a scatterer, and a detector. The function leverages PyVista for rendering the 3D scene.
This script is intended to be used in conjunction with the Read the Docs documentation.
<Figure size 700x700 with 2 Axes>
from PyMieSim.units import ureg

from PyMieSim.single.scatterer import InfiniteCylinder
from PyMieSim.single.source import Gaussian
from PyMieSim.polarization import PolarizationState
from PyMieSim.single.detector import CoherentMode
from PyMieSim.single import Setup


polarization_state = PolarizationState(
    angle=0 * ureg.degree,
)

source = Gaussian(
    wavelength=1550 * ureg.nanometer,
    polarization=polarization_state,
    optical_power=1 * ureg.watt,
    numerical_aperture=0.3,
)

scatterer = InfiniteCylinder(
    diameter=1800 * ureg.nanometer,
    medium=1.0,
    material=1.5,
)

detector = CoherentMode(
    mode_number="LP01",
    numerical_aperture=0.2,
    gamma_offset=0 * ureg.degree,
    phi_offset=30 * ureg.degree,
    rotation=0 * ureg.degree,
    polarization_filter=0 * ureg.degree,
    medium=1.0,
)

setup = Setup(scatterer=scatterer, source=source, detector=detector)

setup.plot_system()
Total running time of the script: (0 minutes 0.215 seconds)