
Note
Go to the end to download the full example code.
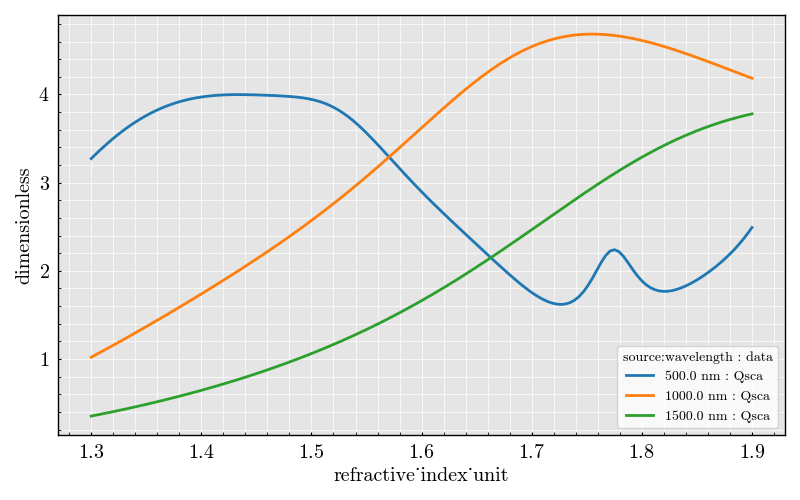
Sphere: Qsca vs index#
<Figure size 1000x600 with 1 Axes>
import numpy as np
from PyMieSim.units import ureg

from PyMieSim.experiment.scatterer_set import SphereSet
from PyMieSim.experiment.source_set import GaussianSet
from PyMieSim.experiment.polarization_set import PolarizationSet
from PyMieSim.experiment import Setup

polarization_set = PolarizationSet(
    angles=[30.0] * ureg.degree,
)

source = GaussianSet(
    wavelength=[500.0, 1000.0, 1500.0] * ureg.nanometer,
    polarization=polarization_set,
    optical_power=[1e-3] * ureg.watt,
    numerical_aperture=[0.2],
)

scatterer = SphereSet(
    diameter=[800.0] * ureg.nanometer,
    material=np.linspace(1.3, 1.9, 100),
    medium=[1.0],
)

experiment = Setup(scatterer_set=scatterer, source_set=source)

dataframe = experiment.get("Qsca")

dataframe.plot(x="scatterer:material")
Total running time of the script: (0 minutes 0.212 seconds)