
Note
Go to the end to download the full example code.
Sphere: Coupling vs diameter#
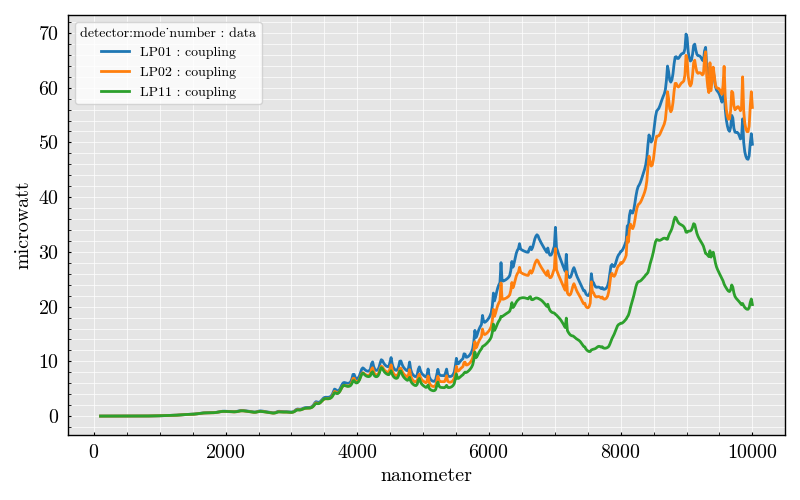
[<matplotlib.lines.Line2D object at 0x7fd4f5572790>, <matplotlib.lines.Line2D object at 0x7fd4f5572a90>, <matplotlib.lines.Line2D object at 0x7fd4f55700d0>]
import numpy
from PyMieSim import (
    ureg,
    CoherentModeSet,
    SphereSet,
    GaussianSet,
    PolarizationSet,
    Experiment,
)


polarization_set = PolarizationSet(
    angles=[90.0] * ureg.degree,
)

source = GaussianSet(
    wavelength=[700] * ureg.nanometer,
    polarization=polarization_set,
    optical_power=[1e-3] * ureg.watt,
    numerical_aperture=[0.1],
)

scatterer = SphereSet(
    diameter=numpy.linspace(100, 10000, 600) * ureg.nanometer,
    material=[1.5],
    medium=[1.0],
)

detector = CoherentModeSet(
    mode_number=["LP01", "LP11", "LP02"],
    numerical_aperture=[0.2],
    rotation=[0] * ureg.degree,
    phi_offset=[0.0] * ureg.degree,
    gamma_offset=[0.0] * ureg.degree,
    sampling=[600],
    mean_coupling=True,
)

experiment = Experiment(scatterer_set=scatterer, source_set=source, detector_set=detector)

result = experiment.get("coupling", drop_unique_level=True)

result.plot(x="scatterer:diameter")
Total running time of the script: (0 minutes 1.013 seconds)