
Note
Go to the end to download the full example code.
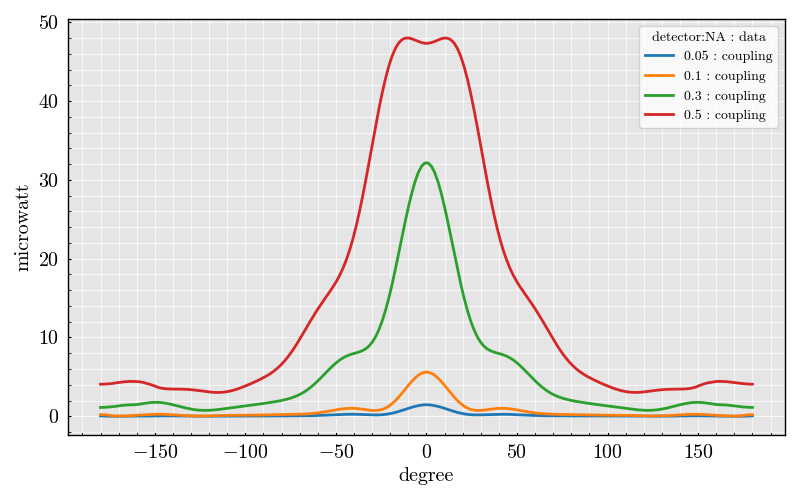
InfiniteCylinder: Goniometer#
This example demonstrates how to use a goniometer setup to measure and visualize the coupling efficiency as a function of angular displacement for cylindrical scatterers using PyMieSim.
+-----------------------+-----------------------+
| Sellmeier Materials   | Tabulated Materials   |
+=======================+=======================+
| BK7                   | aluminium             |
+-----------------------+-----------------------+
| flint                 | nickel                |
+-----------------------+-----------------------+
| argon                 | zinc                  |
+-----------------------+-----------------------+
| lithium_niobate       | silicon               |
+-----------------------+-----------------------+
| soda_lime_glass       | iron                  |
+-----------------------+-----------------------+
| air                   | silver                |
+-----------------------+-----------------------+
| BAK1                  | polyetylene           |
+-----------------------+-----------------------+
| ZBLAN                 | calcium               |
+-----------------------+-----------------------+
| germanium             | sodium                |
+-----------------------+-----------------------+
| polystyren            | copper                |
+-----------------------+-----------------------+
| acetone               | gold                  |
+-----------------------+-----------------------+
| SF5                   |                       |
+-----------------------+-----------------------+
| crown                 |                       |
+-----------------------+-----------------------+
| water                 |                       |
+-----------------------+-----------------------+
| BAF10                 |                       |
+-----------------------+-----------------------+
| fused_silica          |                       |
+-----------------------+-----------------------+

<Figure size 1000x600 with 1 Axes>
import numpy as np
from PyMieSim.units import ureg

from PyMieSim.experiment.detector_set import PhotodiodeSet
from PyMieSim.experiment.scatterer_set import InfiniteCylinderSet
from PyMieSim.experiment.source_set import GaussianSet
from PyMieSim.experiment.polarization_set import PolarizationSet
from PyMieSim.experiment import Setup
from PyMieSim.material import print_available, SellmeierMaterial

print_available()

polarization_set = PolarizationSet(
    angles=[30.0] * ureg.degree,
)

source = GaussianSet(
    wavelength=[1200] * ureg.nanometer,
    polarization=polarization_set,
    optical_power=[1e-3] * ureg.watt,
    numerical_aperture=[0.2],
)

scatterer = InfiniteCylinderSet(
    diameter=[2000] * ureg.nanometer,
    material=[SellmeierMaterial("BK7")],
    medium=[1],
)

detector = PhotodiodeSet(
    numerical_aperture=[0.5, 0.3, 0.1, 0.05],
    phi_offset=np.linspace(-180, 180, 200) * ureg.degree,
    gamma_offset=[0] * ureg.degree,
    sampling=[400],
    polarization_filter=None,
)

experiment = Setup(scatterer_set=scatterer, source_set=source, detector_set=detector)

dataframe = experiment.get("coupling", scale_unit=True)

dataframe.plot(x="detector:phi_offset")
Total running time of the script: (0 minutes 0.345 seconds)