
Note
Go to the end to download the full example code.
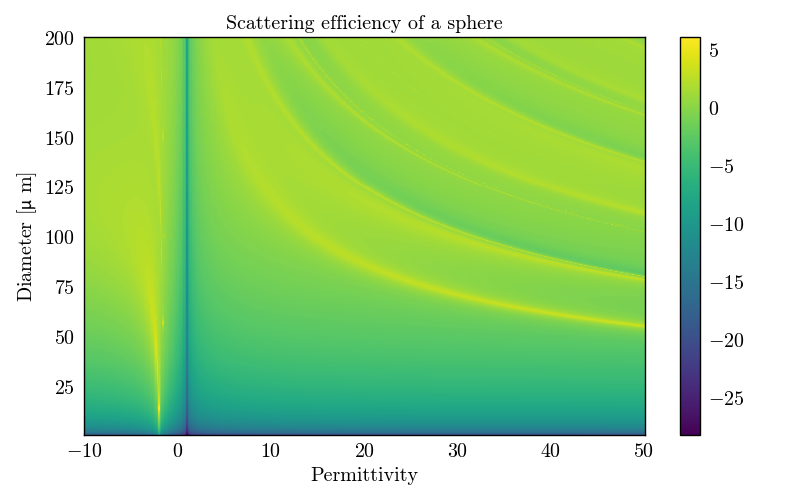
Scattering efficiency of a sphere#
PyMieSim makes it easy to create a source and a scatterer. With these objects defined, it is possible to use PyMieSim to find the scattering efficiency of the scatterer. This feature can be used to plot a graph of the scattering efficiency of a sphere as a function of the permittivity and the size parameter.
import numpy
from PyMieSim.units import ureg
import matplotlib.pyplot as plt

from PyMieSim.experiment.scatterer_set import SphereSet
from PyMieSim.experiment.source_set import GaussianSet
from PyMieSim.experiment.polarization_set import PolarizationSet
from PyMieSim.experiment import Setup

polarization_state = PolarizationSet(
    angles=90 * ureg.degree,
)

permitivity = numpy.linspace(-10, 50, 400)

index = numpy.sqrt(permitivity.astype(complex))

diameter = numpy.linspace(1, 200, 400) * ureg.nanometer

source = GaussianSet(
    wavelength=[400] * ureg.nanometer,
    polarization=polarization_state,
    optical_power=[1e-3] * ureg.watt,
    numerical_aperture=[0.2],
)

scatterer = SphereSet(
    diameter=diameter,
    material=index,
    medium=[1]
)

experiment = Setup(scatterer_set=scatterer, source_set=source)

data = experiment.get("Qsca", as_numpy=True)

figure, ax = plt.subplots(1, 1)
ax.set(
    xlabel="Permittivity",
    ylabel=r"Diameter [$\mu$ m]",
    title="Scattering efficiency of a sphere",
)

image = ax.pcolormesh(permitivity, diameter, numpy.log(data))

plt.colorbar(mappable=image)

plt.show()
Total running time of the script: (0 minutes 1.695 seconds)