
Note
Go to the end to download the full example code.
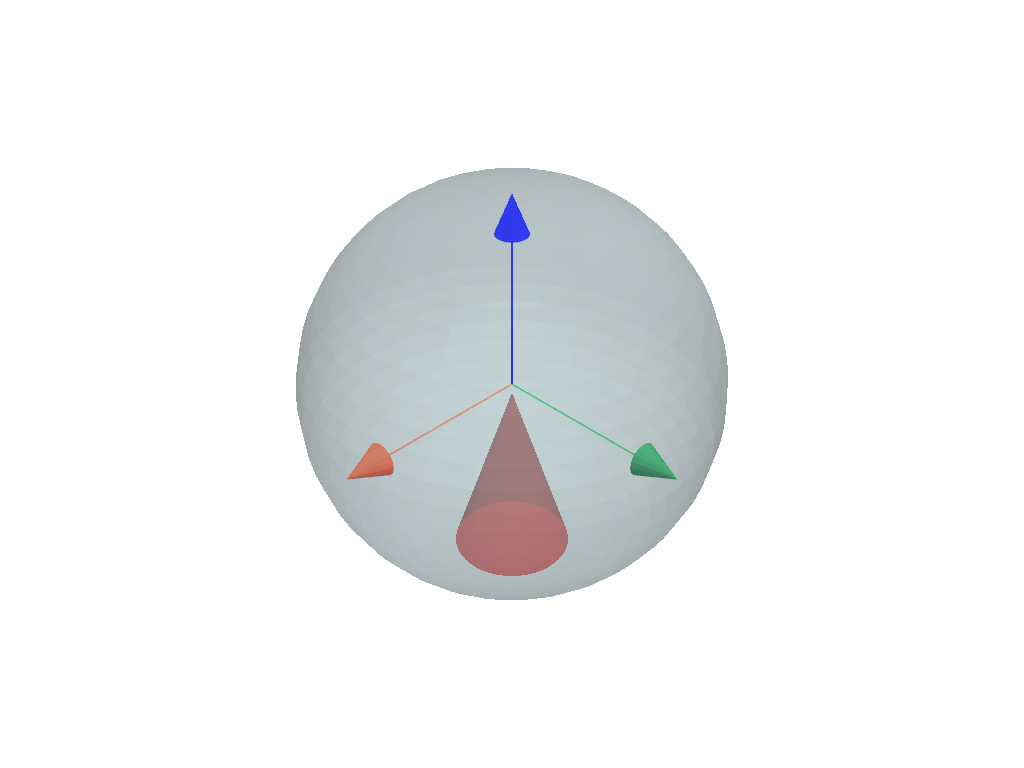
Source Plottings#
This example demonstrates how to visualize the properties of a light source using PyMieSim.
Importing the package: PyMieSim
from TypedUnit import ureg

from PyMieSim.single.source import Gaussian

source = Gaussian(
    wavelength=1 * ureg.nanometer,  # 1000 nm
    polarization=0 * ureg.degree,  # Linear polarization angle in radians
    optical_power=1 * ureg.watt,  # Arbitrary units
    NA=0.3 * ureg.AU,  # Numerical Aperture
)

source.plot()
Total running time of the script: (0 minutes 0.432 seconds)