Note
Go to the end to download the full example code.
Photodiode Angular Weights#
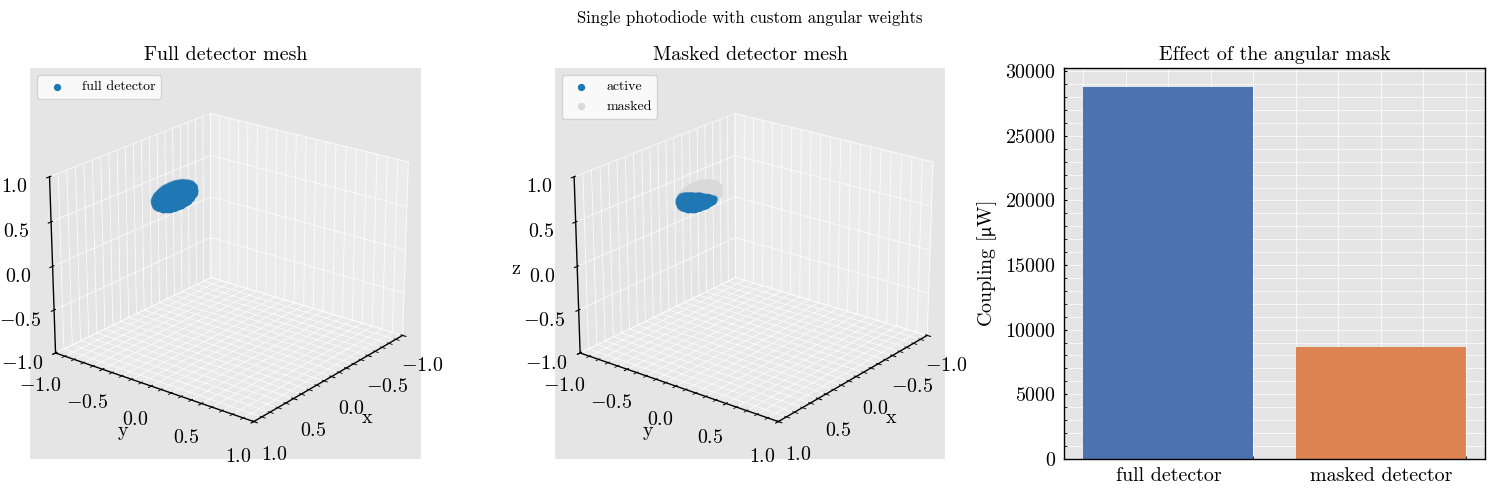
This example demonstrates how to build a custom angular mask on top of the
single-detector Fibonacci mesh using angular_weights.
import numpy as np
import matplotlib.pyplot as plt

from PyMieSim import (
    ureg,
    PolarizationState,
    Gaussian,
    Sphere,
    Photodiode,
    Simulation,
)


source = Gaussian(
    wavelength=1064 * ureg.nanometer,
    polarization=PolarizationState(angle=0 * ureg.degree),
    optical_power=1 * ureg.watt,
    numerical_aperture=0.25,
)

scatterer = Sphere(
    diameter=1200 * ureg.nanometer,
    material=1.46,
    medium=1.0,
)

detector = Photodiode(
    numerical_aperture=0.18,
    phi_offset=30 * ureg.degree,
    gamma_offset=10 * ureg.degree,
    sampling=500,
)

setup = Simulation(
    scatterer=scatterer,
    source=source,
    detector=detector,
)

baseline_coupling = setup.get("coupling")

# Rebuild the current mesh explicitly so the example can derive weights from it.
detector.initialize_mesh(scatterer)

x_coordinates = np.asarray(detector.mesh.cartesian.x.magnitude)
y_coordinates = np.asarray(detector.mesh.cartesian.y.magnitude)
z_coordinates = np.asarray(detector.mesh.cartesian.z.magnitude)

# Keep only one side of the collectio n cone to form a simple half-aperture mask.
active_points = x_coordinates >= 0.50
angular_weights = np.zeros(detector.sampling, dtype=np.complex128)
angular_weights[active_points] = 1.0

detector.angular_weights = angular_weights

weighted_active_points = np.abs(detector.angular_weights) > 0.0

masked_coupling = setup.get("coupling")

figure = plt.figure(figsize=(15, 5))

full_mesh_axis = figure.add_subplot(1, 3, 1, projection="3d")
full_mesh_axis.scatter(
    x_coordinates,
    y_coordinates,
    z_coordinates,
    s=18,
    c="#1f77b4",
    label="full detector",
)
full_mesh_axis.set(
    title="Full detector mesh",
    xlabel="x",
    ylabel="y",
    zlabel="z",
)
full_mesh_axis.legend(loc="upper left")

masked_mesh_axis = figure.add_subplot(1, 3, 2, projection="3d")
masked_mesh_axis.scatter(
    x_coordinates[weighted_active_points],
    y_coordinates[weighted_active_points],
    z_coordinates[weighted_active_points],
    s=18,
    c="#1f77b4",
    label="active",
)
masked_mesh_axis.scatter(
    x_coordinates[~weighted_active_points],
    y_coordinates[~weighted_active_points],
    z_coordinates[~weighted_active_points],
    s=18,
    c="#d9d9d9",
    label="masked",
)
masked_mesh_axis.set(
    title="Masked detector mesh",
    xlabel="x",
    ylabel="y",
    zlabel="z",
)
masked_mesh_axis.legend(loc="upper left")

for axis in (full_mesh_axis, masked_mesh_axis):
    axis.set_xlim(-1.0, 1.0)
    axis.set_ylim(-1.0, 1.0)
    axis.set_zlim(-1.0, 1.0)
    axis.view_init(elev=22, azim=38)

coupling_axis = figure.add_subplot(1, 3, 3)
coupling_values = [
    baseline_coupling.to("microwatt").magnitude,
    masked_coupling.to("microwatt").magnitude,
]
coupling_axis.bar(
    ["full detector", "masked detector"],
    coupling_values,
    color=["#4c72b0", "#dd8452"],
)
coupling_axis.set(
    ylabel="Coupling [$\\mu$W]",
    title="Effect of the angular mask",
)

figure.suptitle("Single photodiode with custom angular weights")
figure.tight_layout()

if plt.get_backend().lower() != "agg":
    plt.show()
Total running time of the script: (0 minutes 0.485 seconds)