
Note
Go to the end to download the full example code.
Parameter-grid scaling#
Measure the effect of expanding two sweep dimensions: particle diameter and material refractive index.
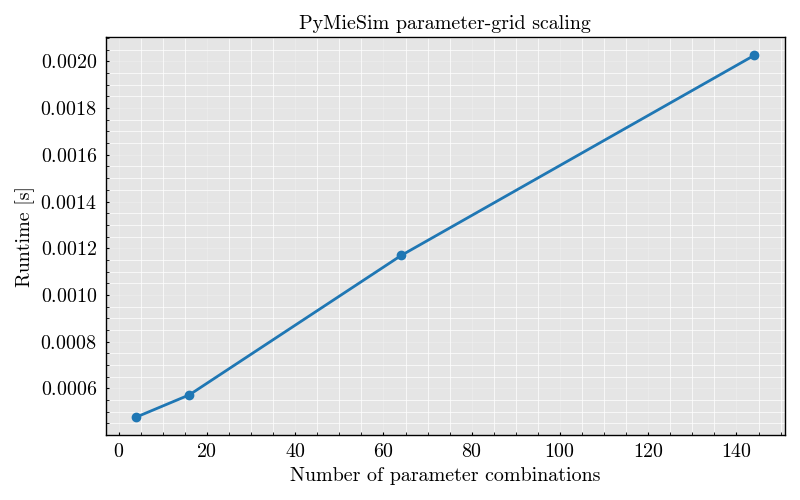
  4 combinations | 0.0005 s | 4 results
 16 combinations | 0.0006 s | 16 results
 64 combinations | 0.0012 s | 64 results
144 combinations | 0.0020 s | 144 results
import time

import matplotlib.pyplot as plt
import numpy as np

from PyMieSim import Experiment, GaussianSet, PolarizationSet, SphereSet, ureg


def run_grid(size: int) -> tuple[float, int]:
    source = GaussianSet(
        wavelength=[600] * ureg.nanometer,
        polarization=PolarizationSet(angles=[0] * ureg.degree),
        optical_power=[1e-3] * ureg.watt,
        numerical_aperture=[0.2],
    )
    scatterer = SphereSet(
        diameter=np.linspace(100, 1000, size) * ureg.nanometer,
        material=np.linspace(1.3, 1.8, size),
        medium=[1.0],
    )
    experiment = Experiment(scatterer_set=scatterer, source_set=source)

    start = time.perf_counter()
    result = experiment.get("Qsca").as_numpy()
    return time.perf_counter() - start, int(np.asarray(result).size)


grid_sizes = [2, 4, 8, 12]
measurements = [run_grid(size) for size in grid_sizes]
runtime_seconds, result_sizes = np.asarray(measurements).T
configuration_counts = np.square(grid_sizes)

figure, axis = plt.subplots()
axis.plot(configuration_counts, runtime_seconds, marker="o")
axis.set(
    xlabel="Number of parameter combinations",
    ylabel="Runtime [s]",
    title="PyMieSim parameter-grid scaling",
)
axis.grid(True, alpha=0.3)
figure.tight_layout()

for combinations, runtime, results in zip(
    configuration_counts, runtime_seconds, result_sizes
):
    print(f"{combinations:4d} combinations | {runtime:.4f} s | {int(results)} results")

plt.show()
Total running time of the script: (0 minutes 0.225 seconds)