
Note
Go to the end to download the full example code.
Memory scaling with sweep size#
Estimate Python-managed peak memory for increasingly large parameter sweeps.
tracemalloc does not include all native allocations made by the C++
extension; use an operating-system profiler for complete process memory.
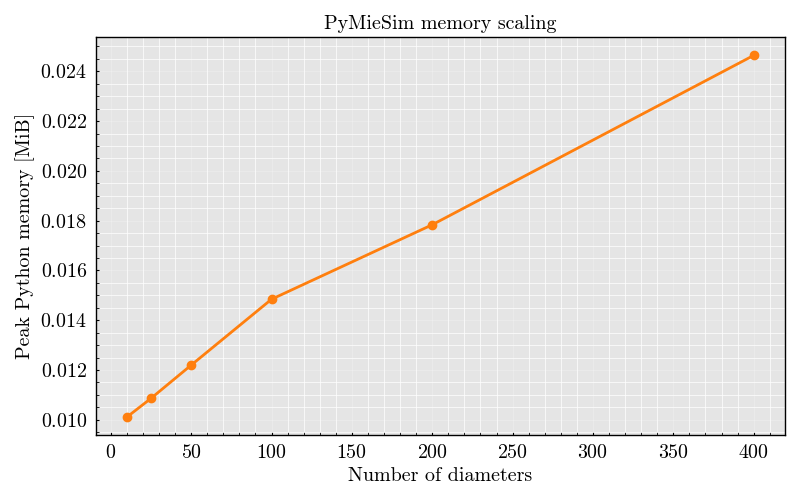
 10 diameters | 0.010 MiB peak Python memory
 25 diameters | 0.011 MiB peak Python memory
 50 diameters | 0.012 MiB peak Python memory
100 diameters | 0.015 MiB peak Python memory
200 diameters | 0.018 MiB peak Python memory
400 diameters | 0.025 MiB peak Python memory
import gc
import tracemalloc

import matplotlib.pyplot as plt
import numpy as np

from PyMieSim import Experiment, GaussianSet, PolarizationSet, SphereSet, ureg


def peak_memory(number_of_diameters: int) -> float:
    gc.collect()
    tracemalloc.start()

    source = GaussianSet(
        wavelength=[600] * ureg.nanometer,
        polarization=PolarizationSet(angles=[0] * ureg.degree),
        optical_power=[1e-3] * ureg.watt,
        numerical_aperture=[0.2],
    )
    scatterer = SphereSet(
        diameter=np.linspace(100, 1000, number_of_diameters) * ureg.nanometer,
        material=[1.5],
        medium=[1.0],
    )
    Experiment(scatterer_set=scatterer, source_set=source).get("Qsca").as_numpy()

    _, peak_bytes = tracemalloc.get_traced_memory()
    tracemalloc.stop()
    return peak_bytes / 1024**2


sweep_sizes = [10, 25, 50, 100, 200, 400]
peak_memory_mib = [peak_memory(size) for size in sweep_sizes]

for size, memory in zip(sweep_sizes, peak_memory_mib):
    print(f"{size:4d} diameters | {memory:.3f} MiB peak Python memory")

figure, axis = plt.subplots()
axis.plot(sweep_sizes, peak_memory_mib, marker="o", color="tab:orange")
axis.set(
    xlabel="Number of diameters",
    ylabel="Peak Python memory [MiB]",
    title="PyMieSim memory scaling",
)
axis.grid(True, alpha=0.3)
figure.tight_layout()
plt.show()
Total running time of the script: (0 minutes 0.560 seconds)